Fig. 6
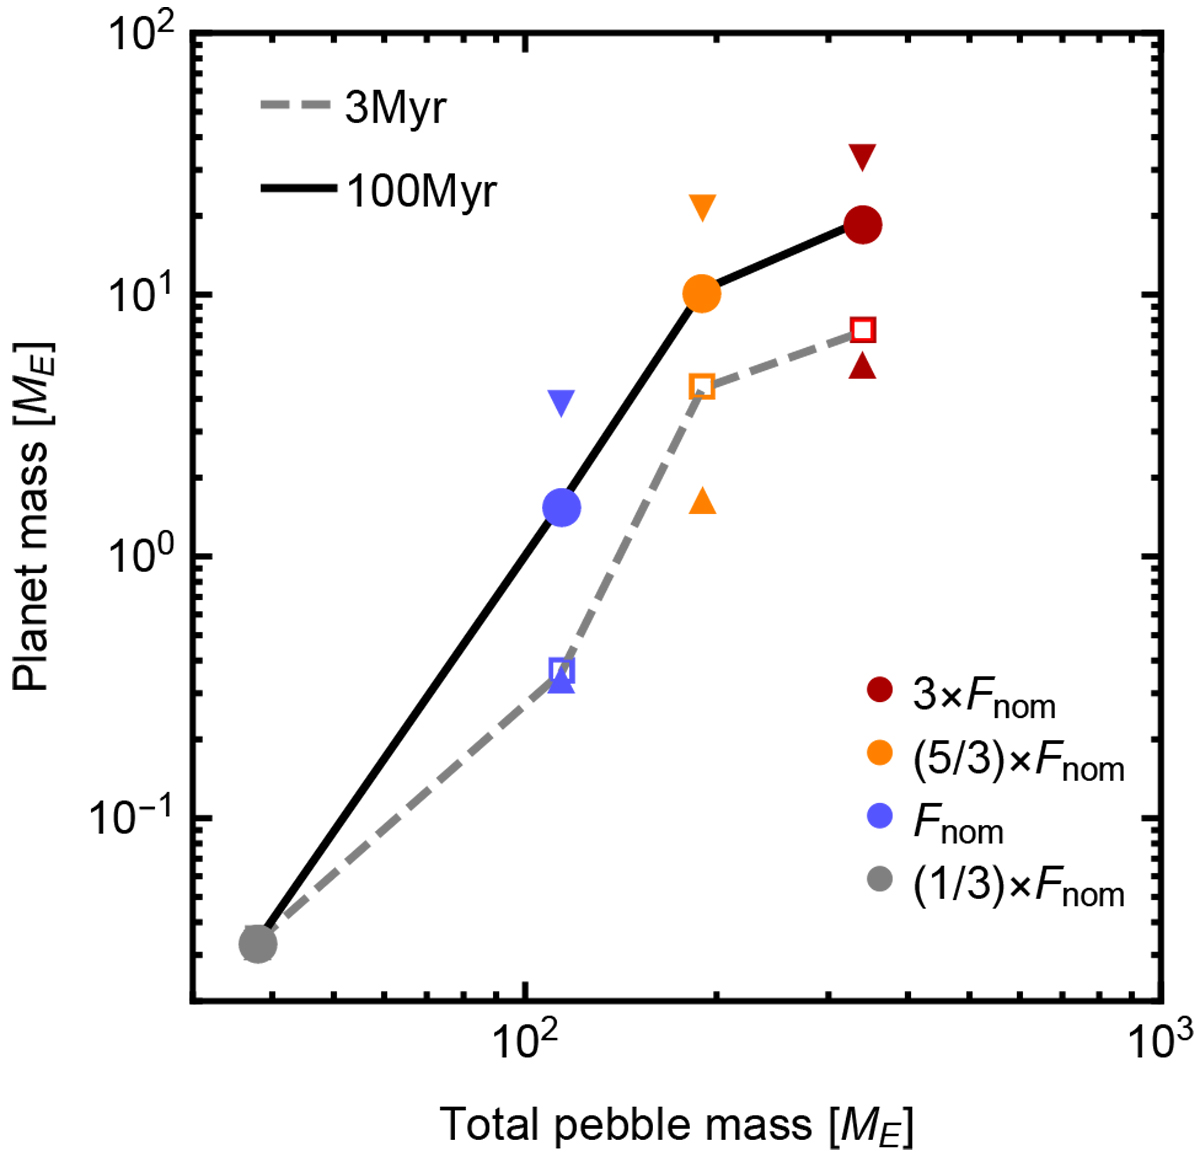
Final planet mass as a function of the integrated pebble flux. Circles, connected with the full black curve, give the mean planet mass across a suite of runs with the same pebble flux, while triangles represent the minimal and maximal embryo mass across all runs with the same pebble flux. The squares, connected by the grey dashed line, give the mean embryo mass at the time of disc dissipation.
Current usage metrics show cumulative count of Article Views (full-text article views including HTML views, PDF and ePub downloads, according to the available data) and Abstracts Views on Vision4Press platform.
Data correspond to usage on the plateform after 2015. The current usage metrics is available 48-96 hours after online publication and is updated daily on week days.
Initial download of the metrics may take a while.