Free Access
Fig. 3
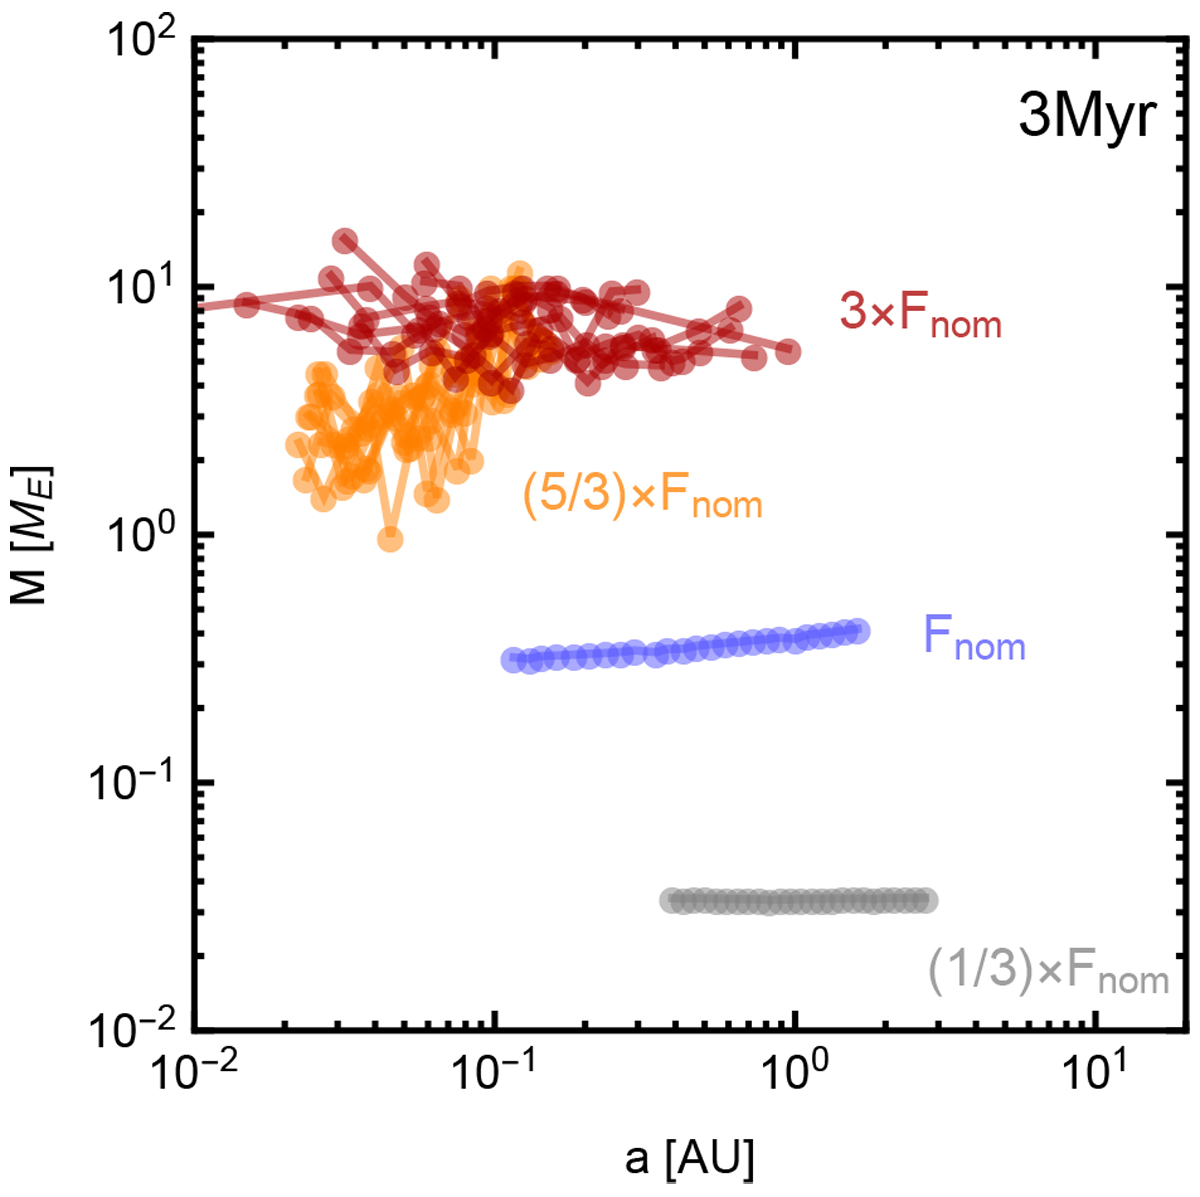
Final system architecture, given as the embryo mass vs. orbital distance, at disc dissipation (3 Myr). Different colours represent different pebble mass fluxes: blue, orange, and red experienced, respectively, 3, 5, and 9 times higher mass flux than the grey systems.
Current usage metrics show cumulative count of Article Views (full-text article views including HTML views, PDF and ePub downloads, according to the available data) and Abstracts Views on Vision4Press platform.
Data correspond to usage on the plateform after 2015. The current usage metrics is available 48-96 hours after online publication and is updated daily on week days.
Initial download of the metrics may take a while.