Fig. 1
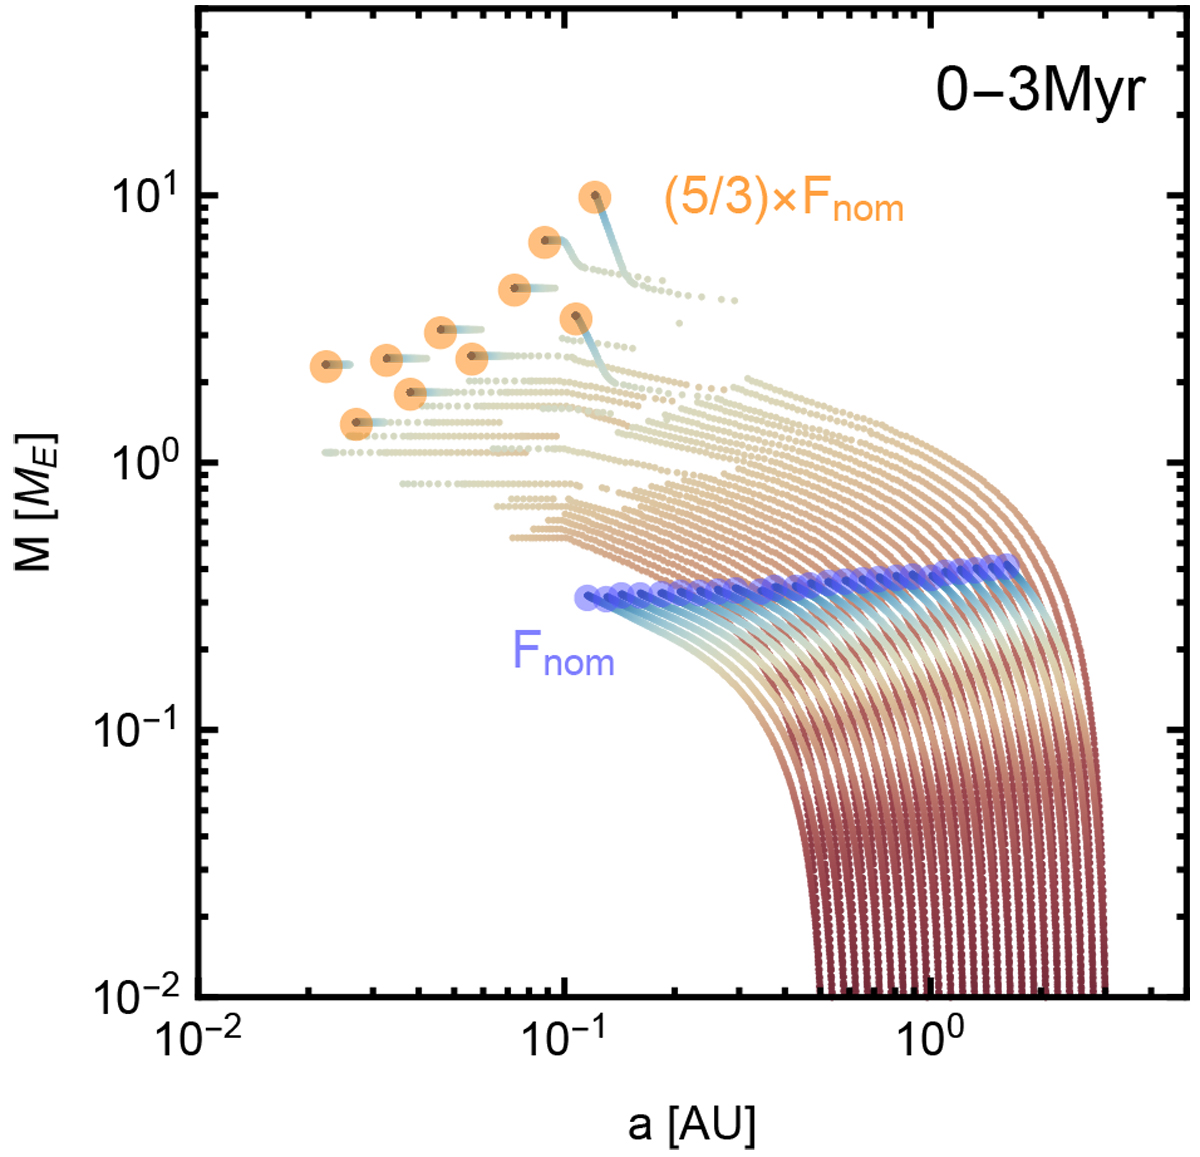
Embryo mass and semi-major axis for each embryo as a function of time, for two different global pebble mass fluxes. Growth tracks resulting in the final system indicated with blue circles correspond to runf3-1. The system indicated by orange circles corresponds to runf5-1, which experienced a higher pebble flux by a factor of 1.7.
Current usage metrics show cumulative count of Article Views (full-text article views including HTML views, PDF and ePub downloads, according to the available data) and Abstracts Views on Vision4Press platform.
Data correspond to usage on the plateform after 2015. The current usage metrics is available 48-96 hours after online publication and is updated daily on week days.
Initial download of the metrics may take a while.