Fig. 7
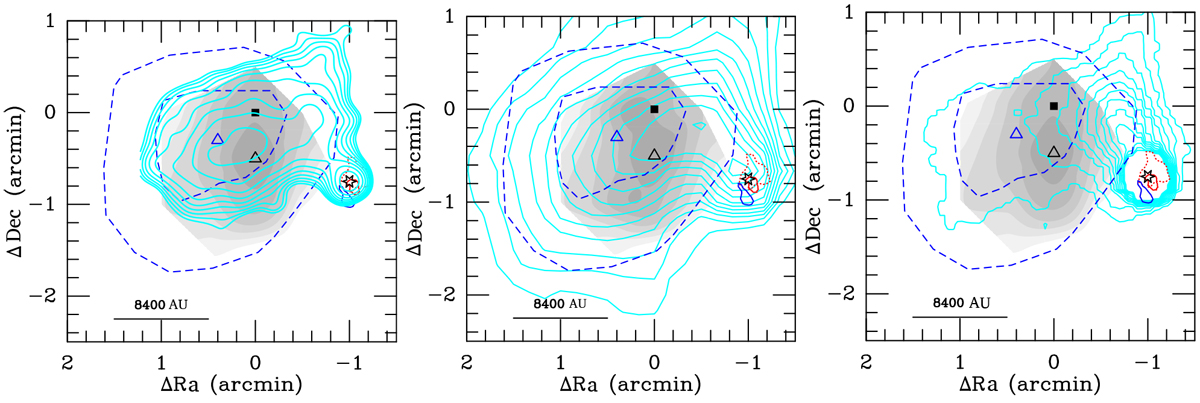
Left: the HC3N core (gray-scale) and the NH3 (1,1) core (blue dashed lines, quoted from Myers et al. 1988) overlaid on the JCMT SCUBA 850 μm continuum data from JCMT proposal ID M97AN16 (Hogerheijde & Sandell 2000) (cyan contours, evenly stepped from 0.075 to 0.75 Jy beam−1 in log-scale). The gray and blue triangles denote the peaks of the EMC (P point) and NH3, respectively. The IRS is also marked on the map (hexagonal star). The blue and red wings of the CO (3− 2) outflow (blue solid and red dotted lines, quoted from Hogerheijde et al. 1998) and the medium infalling lobe (red solid line, quoted from Yen et al. 2014) were also overlaid on the figure. Middle: as in left panel except cyan contours representing Herschel SPIRE 500 μm continuum map, from 1.5 Jy beam−1 to 5 Jy beam−1 stepped by 0.3 Jy beam−1. Right: as in left panel except cyan contours representing Herschel SPIRE 250 μm continuum contours, from 1.5 to 5 Jy beam−1 stepped by 0.3 Jy beam−1. Fluxes around the IRS are centrally peaked but higher level contours are not shown.
Current usage metrics show cumulative count of Article Views (full-text article views including HTML views, PDF and ePub downloads, according to the available data) and Abstracts Views on Vision4Press platform.
Data correspond to usage on the plateform after 2015. The current usage metrics is available 48-96 hours after online publication and is updated daily on week days.
Initial download of the metrics may take a while.