Free Access
Fig. 5
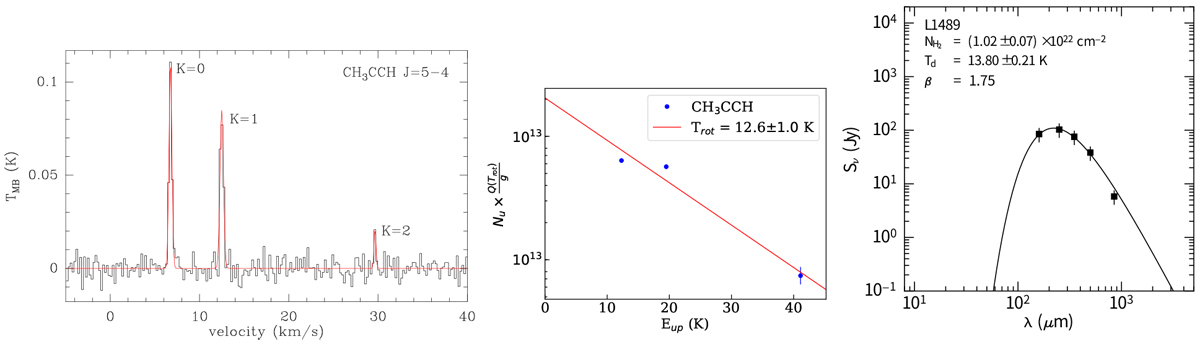
Left: spectra of CH3CCH J = 5− 4, K = 0,1,2. Middle: rotation temperature diagram of CH3CCH. Right: SED of the L1489 IRS from the PACS 160 μm and SPIRE wavelengths of Herschel as well as SCUBA 850 μm. The filled squares represent the input fluxes. The line shows the best fitting of the gray-body model.
Current usage metrics show cumulative count of Article Views (full-text article views including HTML views, PDF and ePub downloads, according to the available data) and Abstracts Views on Vision4Press platform.
Data correspond to usage on the plateform after 2015. The current usage metrics is available 48-96 hours after online publication and is updated daily on week days.
Initial download of the metrics may take a while.