Fig. 3
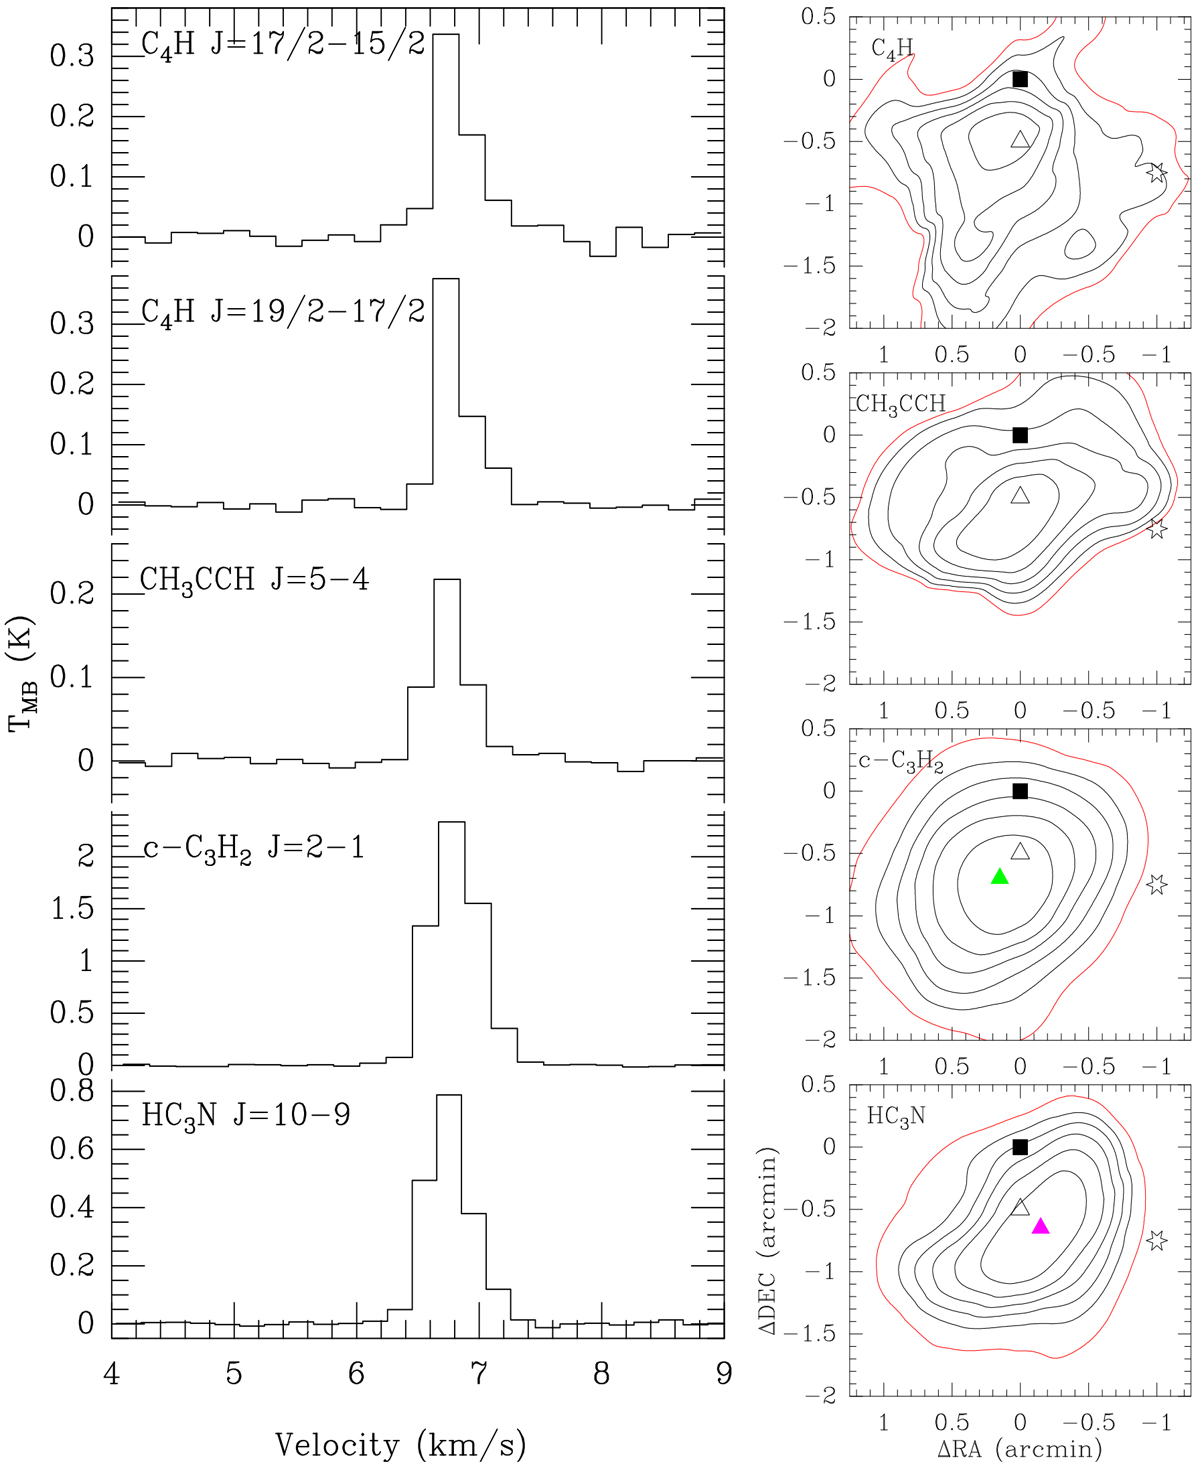
Emissions of the transitions in the 3 mm band. Left: spectral lines of the P point. Right: emission intensity contours from 50 to 90% in steps of 10% of the peak value (see Table 2). C4H N = 9−8, J = 19/2−17/2 and C4 H N = 9−8, J = 17/2−15/2 are summed up and shown as C4H intensity contours. Red contours represent 3σ of integrated emissions. The symbols are the same as those in Fig. 1c. The green and pink filled triangles represent peak position of c-C3H2 J = 2−1 and HC3N J = 10−9 emission, respectively.
Current usage metrics show cumulative count of Article Views (full-text article views including HTML views, PDF and ePub downloads, according to the available data) and Abstracts Views on Vision4Press platform.
Data correspond to usage on the plateform after 2015. The current usage metrics is available 48-96 hours after online publication and is updated daily on week days.
Initial download of the metrics may take a while.