Fig. 1
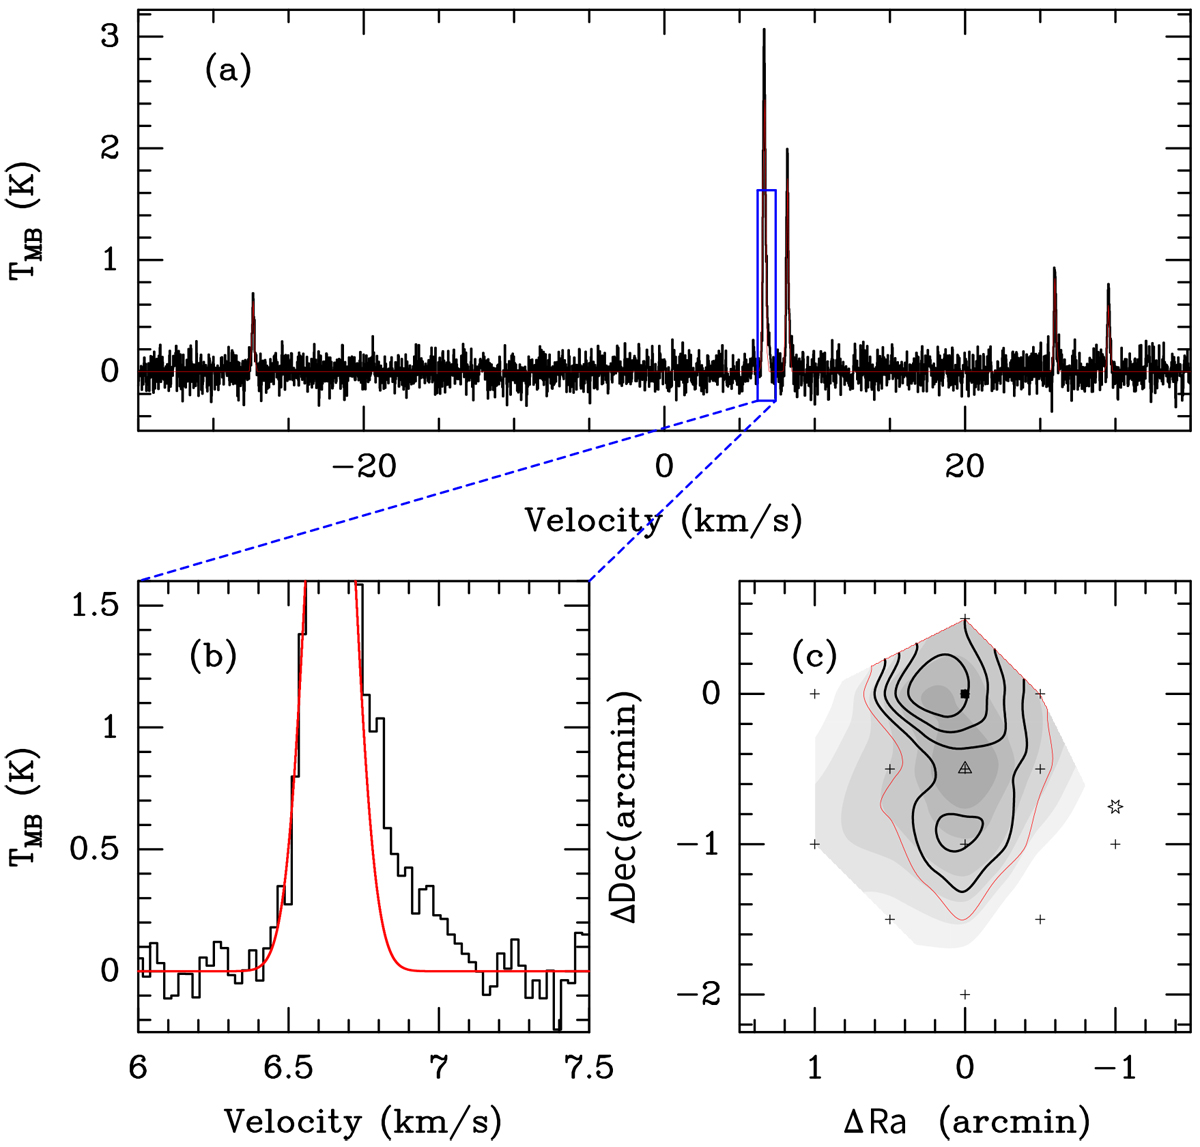
(a) HC3N J = 2−1, F = 3− 2 spectrum of the peak position. Red lines show the Gaussian fitting. (b) Zoom-in of panel a showing line wing of HC3 N J = 2− 1, F = 3− 2. (c) Background is integrated map of HC3N J = 2−1, F = 3− 2. Black contours represent integration of red wing (6.75–7.08 km s−1) of HC3 N J = 2–1, F = 3–2 stepped from 60 to 90% by 10% of maximum value 0.14 K km s−1. The red contour denotes 3σ level (0.06 K km s−1) of HC3 N wing integration.The filled black square represents O point, and the black triangle represents P point (see text). The IRS is shown by the hexagonal star (Yen et al. 2014). Small black crosses show sampled points of Ku band observation.
Current usage metrics show cumulative count of Article Views (full-text article views including HTML views, PDF and ePub downloads, according to the available data) and Abstracts Views on Vision4Press platform.
Data correspond to usage on the plateform after 2015. The current usage metrics is available 48-96 hours after online publication and is updated daily on week days.
Initial download of the metrics may take a while.