Fig. 6.
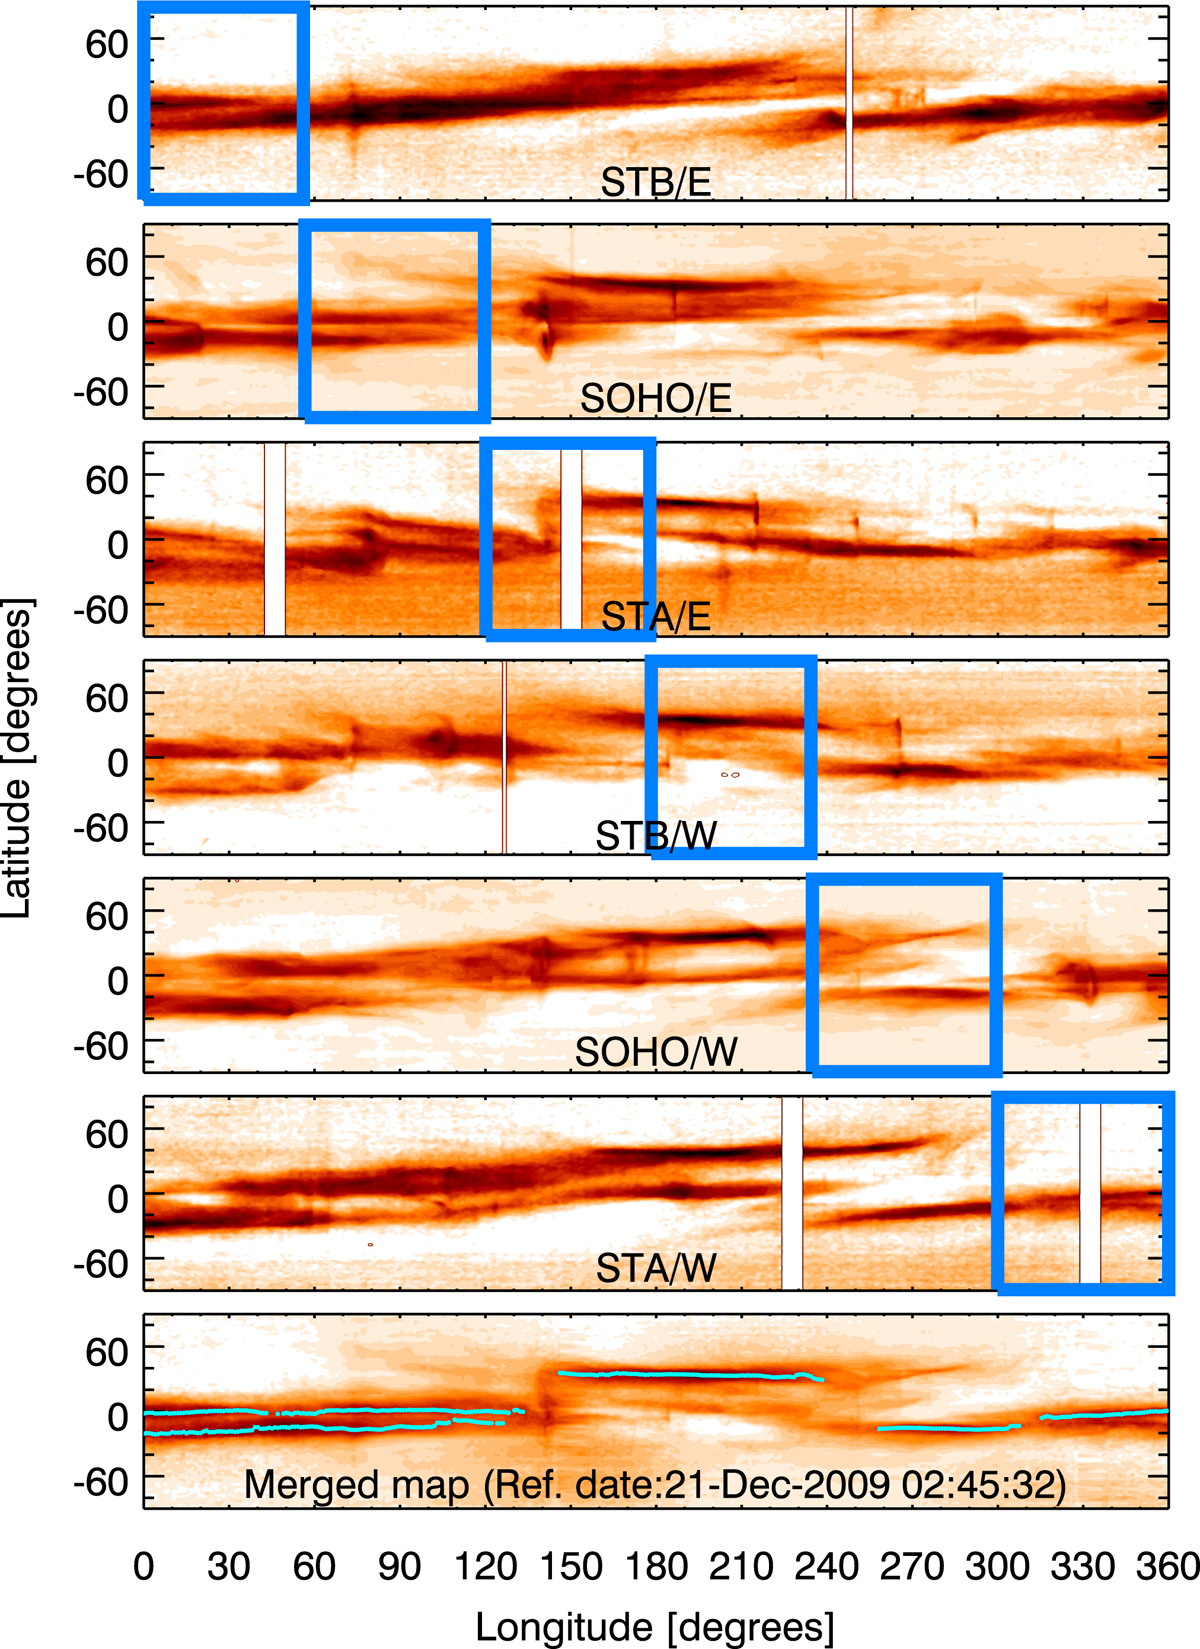
East and west limb Carrington maps observed by the STA/COR1, SOHO/C2, and STB/COR1 coronagraphs for the CR 2091, at 2.5 R⊙ and the merged map obtained by their combinations (bottom panel); the position of the streamer cusps (cyan lines) are overplotted. The blue box defines the part of the maps that is observed at the same time by the instruments.
Current usage metrics show cumulative count of Article Views (full-text article views including HTML views, PDF and ePub downloads, according to the available data) and Abstracts Views on Vision4Press platform.
Data correspond to usage on the plateform after 2015. The current usage metrics is available 48-96 hours after online publication and is updated daily on week days.
Initial download of the metrics may take a while.