Fig. 4.
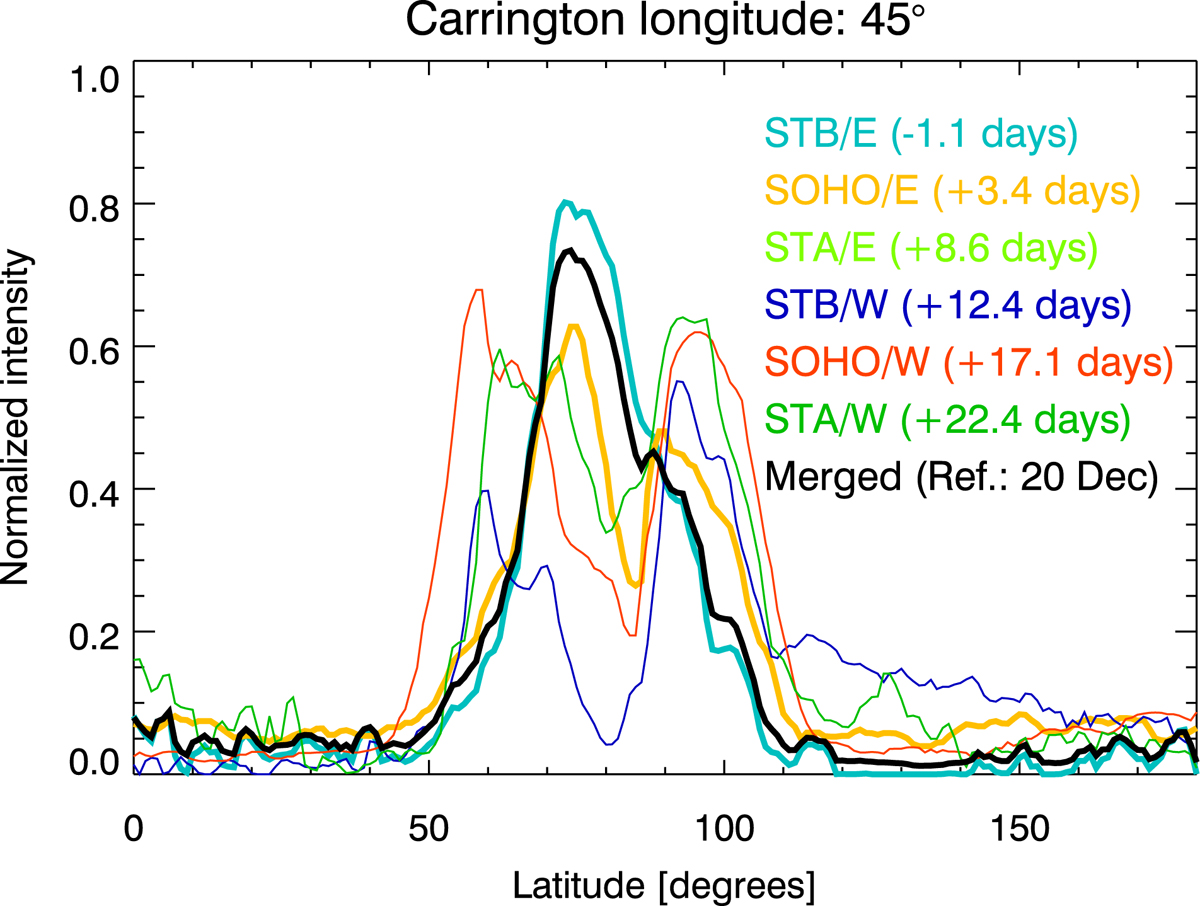
Normalized intensity of the slices at 45° longitude of the six Carrington maps represented in Fig. 2 at 2.5 R⊙ for CR 2091 (color-coding given in the figure legend), together with the weighted averaged intensity computed as described in Sect. 2.2, shown as a solid black line and indicated as “Merged” in the legend. The slices closest in time to the reference time (Δti at 45° longitude, for each map, as indicated in the legend) are also shown using thicker lines. The slice contributing mostly to the merged slice (black line) is the one with Δti at that longitude of 1.1 days (slice of STB/E, cyan line).
Current usage metrics show cumulative count of Article Views (full-text article views including HTML views, PDF and ePub downloads, according to the available data) and Abstracts Views on Vision4Press platform.
Data correspond to usage on the plateform after 2015. The current usage metrics is available 48-96 hours after online publication and is updated daily on week days.
Initial download of the metrics may take a while.