Fig. 3.
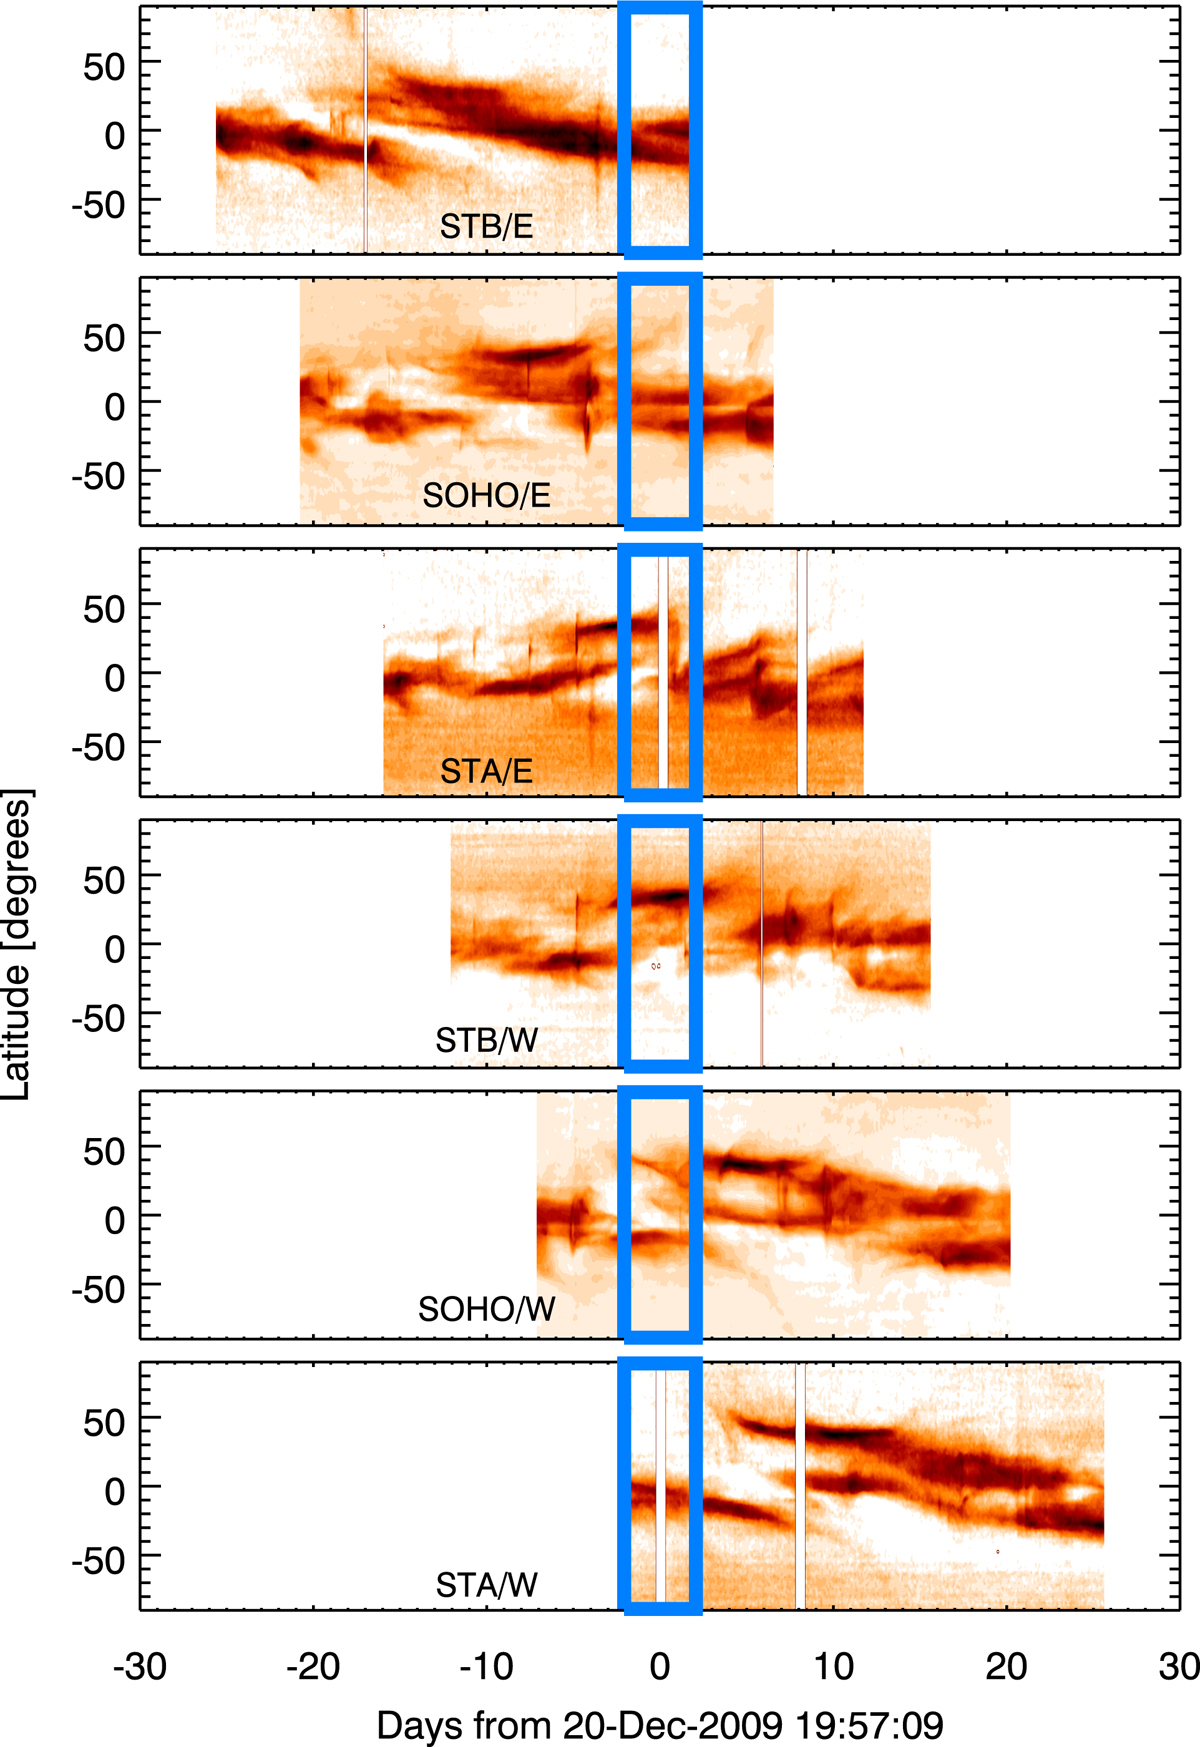
Normalized Carrington maps (same as Fig. 2) at 2.5 R⊙ for CR 2091 from STB, SOHO, and STA, aligned to a common reference time. The blue box indicates the parts of the maps observed within ±2 days from the center date of CR 2091. By collating these six boxes (starting from STB east and ending with STA west), we can obtain a near-synchronic (to within about five days) map of the entire corona.
Current usage metrics show cumulative count of Article Views (full-text article views including HTML views, PDF and ePub downloads, according to the available data) and Abstracts Views on Vision4Press platform.
Data correspond to usage on the plateform after 2015. The current usage metrics is available 48-96 hours after online publication and is updated daily on week days.
Initial download of the metrics may take a while.