Free Access
Fig. 2.
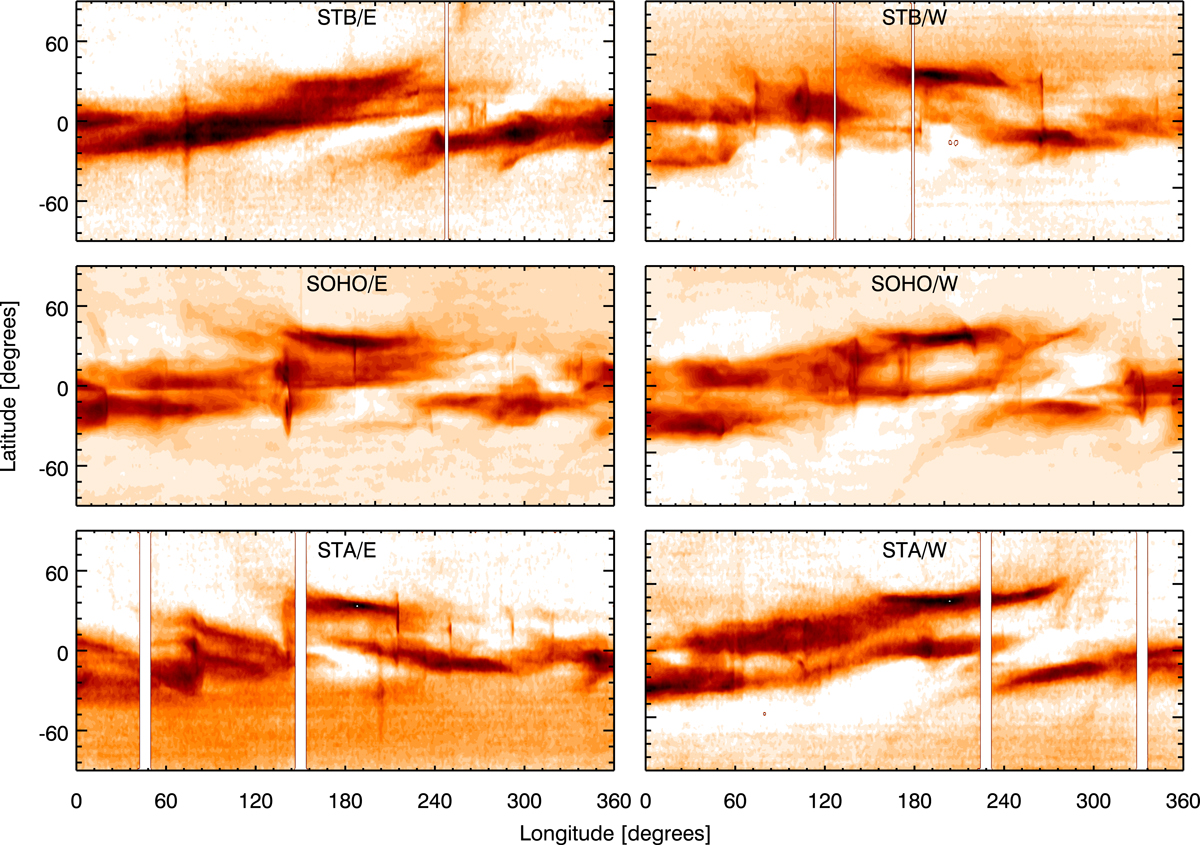
Carrington maps at 2.5 R⊙ for CR 2091 from STB/COR1 (top), SOHO/C2 (middle), and STB/COR1 (bottom) for the east and west limb of the Sun (left and right column, respectively). Images are displayed in a reverse color scale, i.e., brighter coronal features are shown in darker colors.
Current usage metrics show cumulative count of Article Views (full-text article views including HTML views, PDF and ePub downloads, according to the available data) and Abstracts Views on Vision4Press platform.
Data correspond to usage on the plateform after 2015. The current usage metrics is available 48-96 hours after online publication and is updated daily on week days.
Initial download of the metrics may take a while.