Fig. 8.
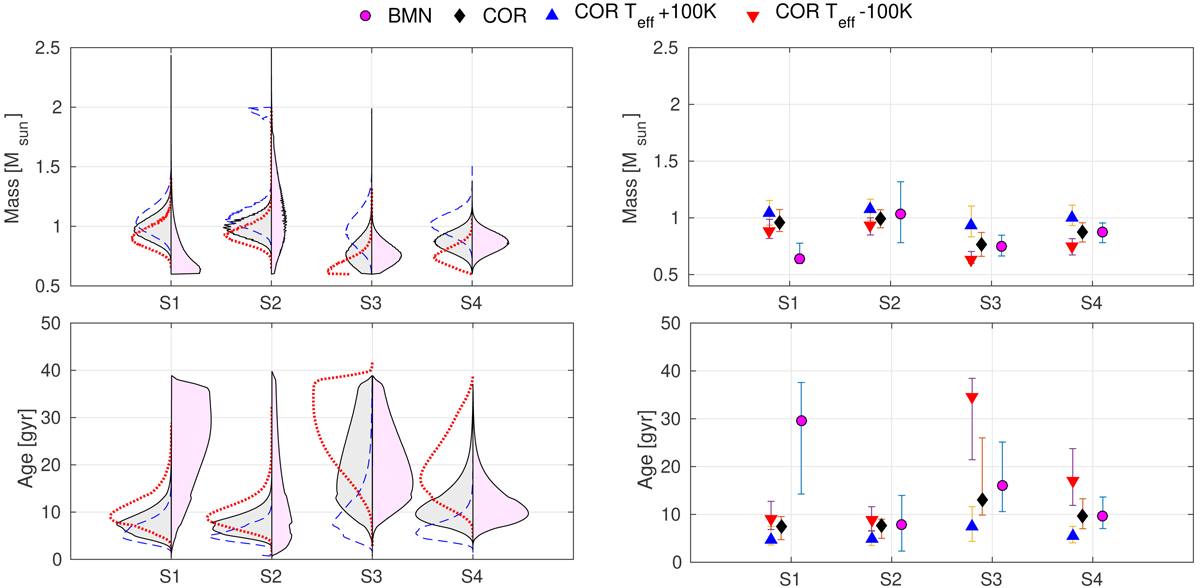
Left column: violin plot of the PDFs of mass (top) and age (bottom). The right magenta shaded PDF is derived using the parameters from BM_N seismic set of parameters; the new errors take into account dispersion between pipelines and the PDFs on the left of the violin are calculated using seismic parameters from COR pipeline (black line, grey shaded) and varying the Teff of +100 K (dashed blue line) or −100 K (dotted red line). Right column: modes and 68 percentile errorbar of masses (top) and ages (bottom) of the 4 stars of this work. Magenta points indicate values computed using BM_N seismic values, black diamonds indicate the values derived using COR seismic values, and red and blue triangles indicate values obtained using COR seismic values and varying the Teff of −100 and +100 K, respectively.
Current usage metrics show cumulative count of Article Views (full-text article views including HTML views, PDF and ePub downloads, according to the available data) and Abstracts Views on Vision4Press platform.
Data correspond to usage on the plateform after 2015. The current usage metrics is available 48-96 hours after online publication and is updated daily on week days.
Initial download of the metrics may take a while.