Fig. 7.
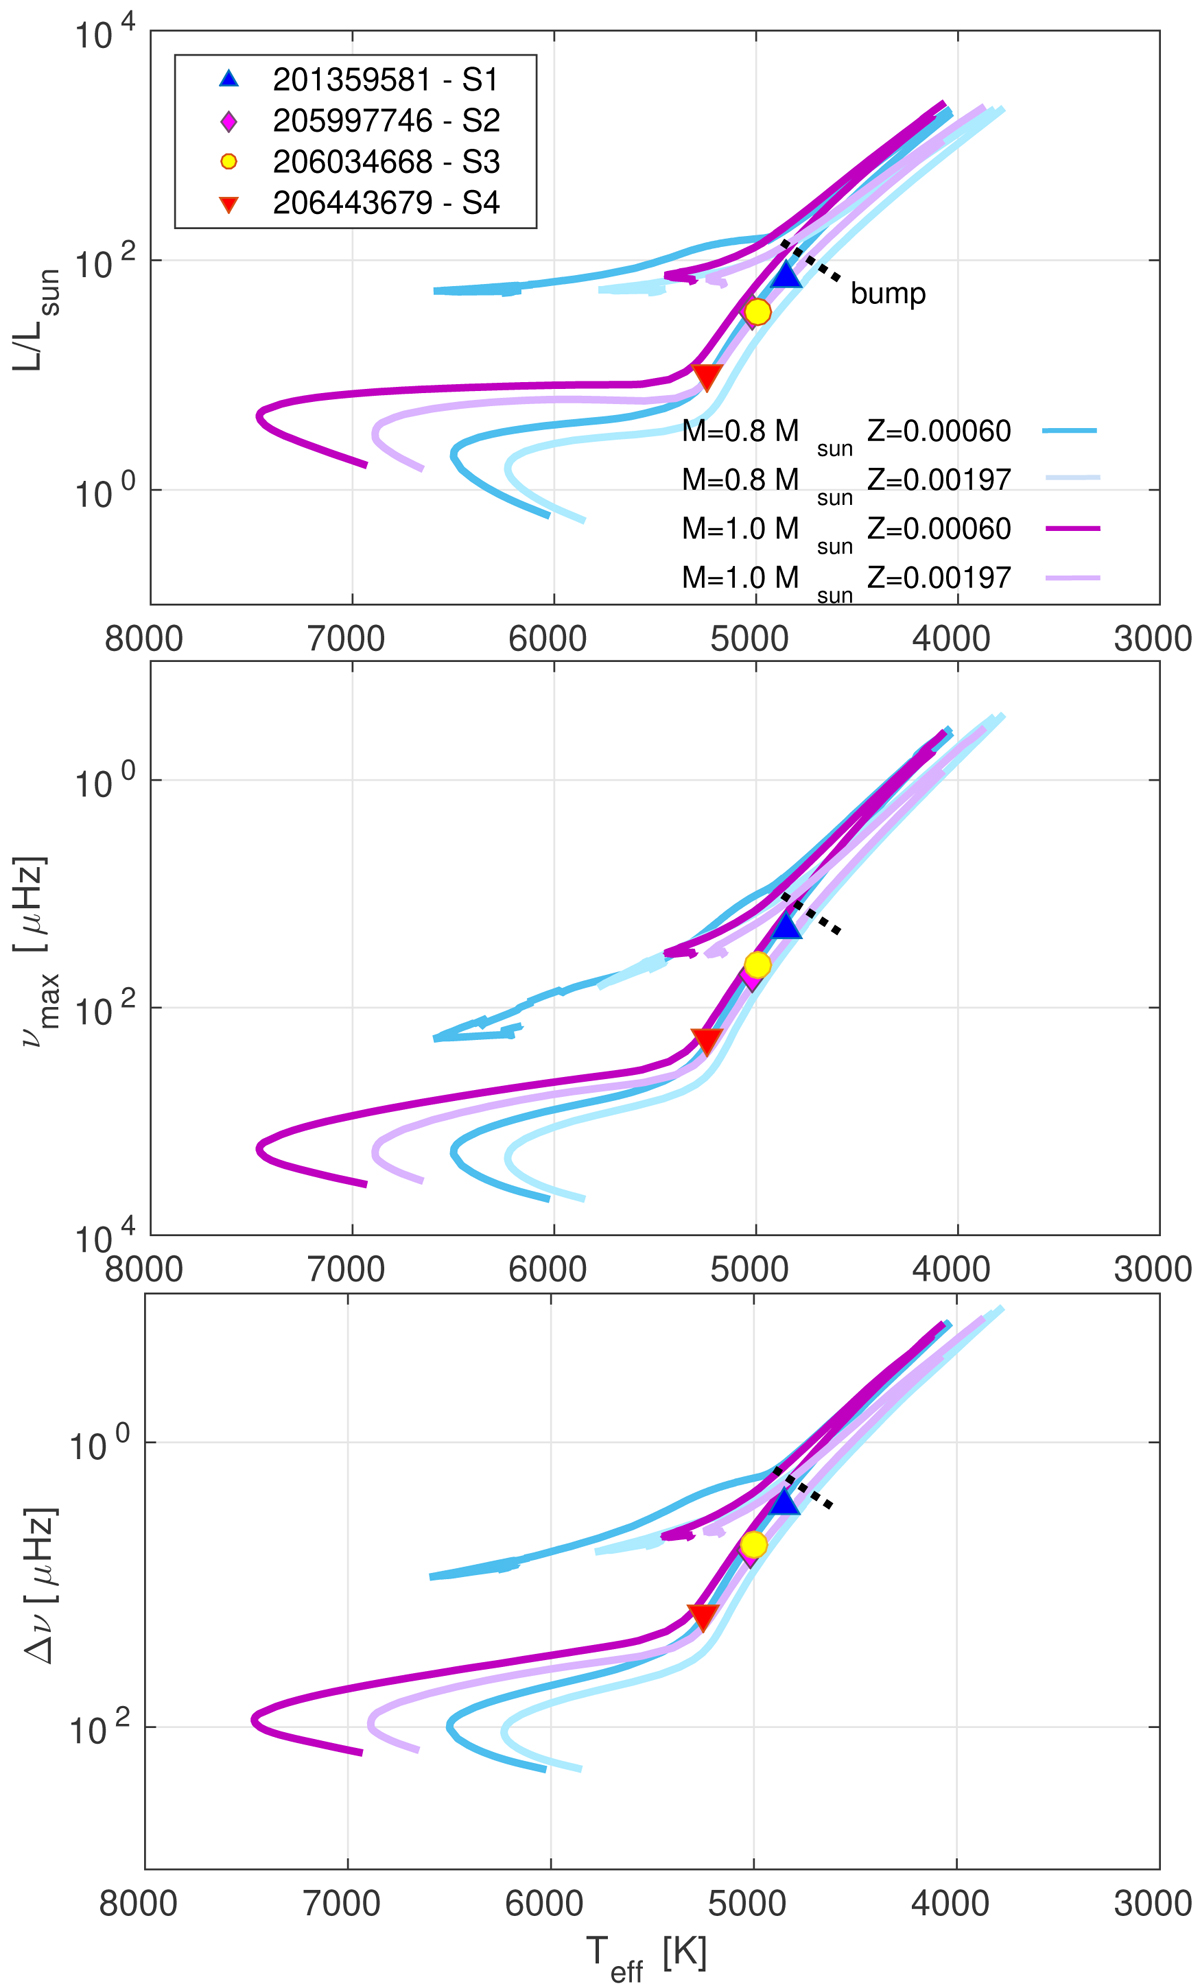
Top panel: position in the temperature – luminosity diagram of the 4 RAVE stars of this work (nomenclature following Table 1). Evolutionary tracks at masses M = 0.8 and 1.0 M⊙, at two different metallicities (Z = 0.00060 and 0.00197) are plotted. Middle panel: position in the temperature – νmax diagram of the four RAVE stars of this work, same tracks as top panel. Bottom panel: position in the temperature – Δν diagram of the four RAVE stars of this work, same tracks as top panel. Error bars of the plotted quantities are of the size of the points.
Current usage metrics show cumulative count of Article Views (full-text article views including HTML views, PDF and ePub downloads, according to the available data) and Abstracts Views on Vision4Press platform.
Data correspond to usage on the plateform after 2015. The current usage metrics is available 48-96 hours after online publication and is updated daily on week days.
Initial download of the metrics may take a while.