Free Access
Fig. 3.
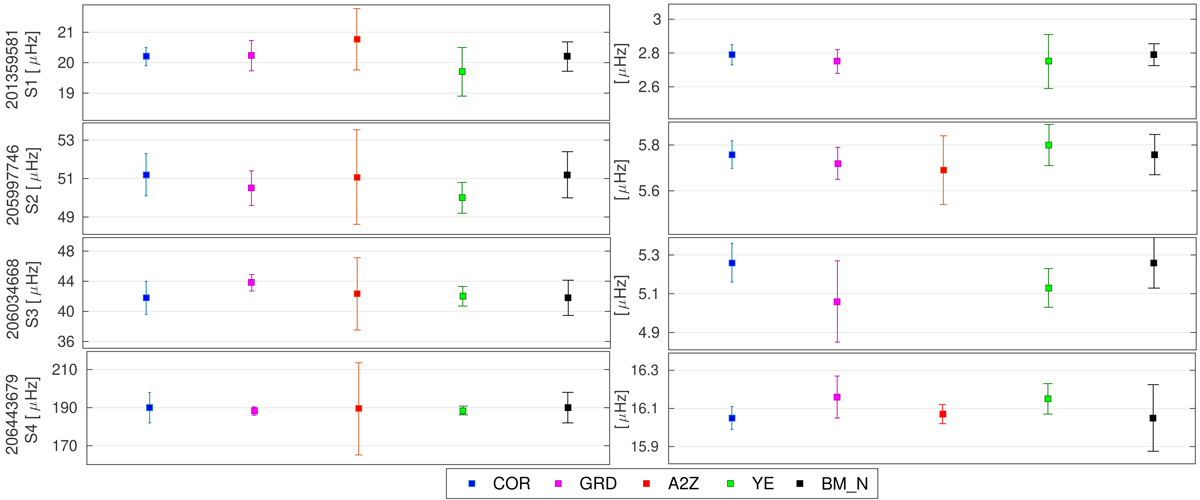
Δν and νmax as measured by different pipelines. Each colour (blue, magenta, red, and green) corresponds to a different pipeline (COR, GRD, A2Z, and YE; see appendix). The values plotted in black correspond to a further test using COR with inflated uncertainties (BM_N).
Current usage metrics show cumulative count of Article Views (full-text article views including HTML views, PDF and ePub downloads, according to the available data) and Abstracts Views on Vision4Press platform.
Data correspond to usage on the plateform after 2015. The current usage metrics is available 48-96 hours after online publication and is updated daily on week days.
Initial download of the metrics may take a while.