Fig. 10
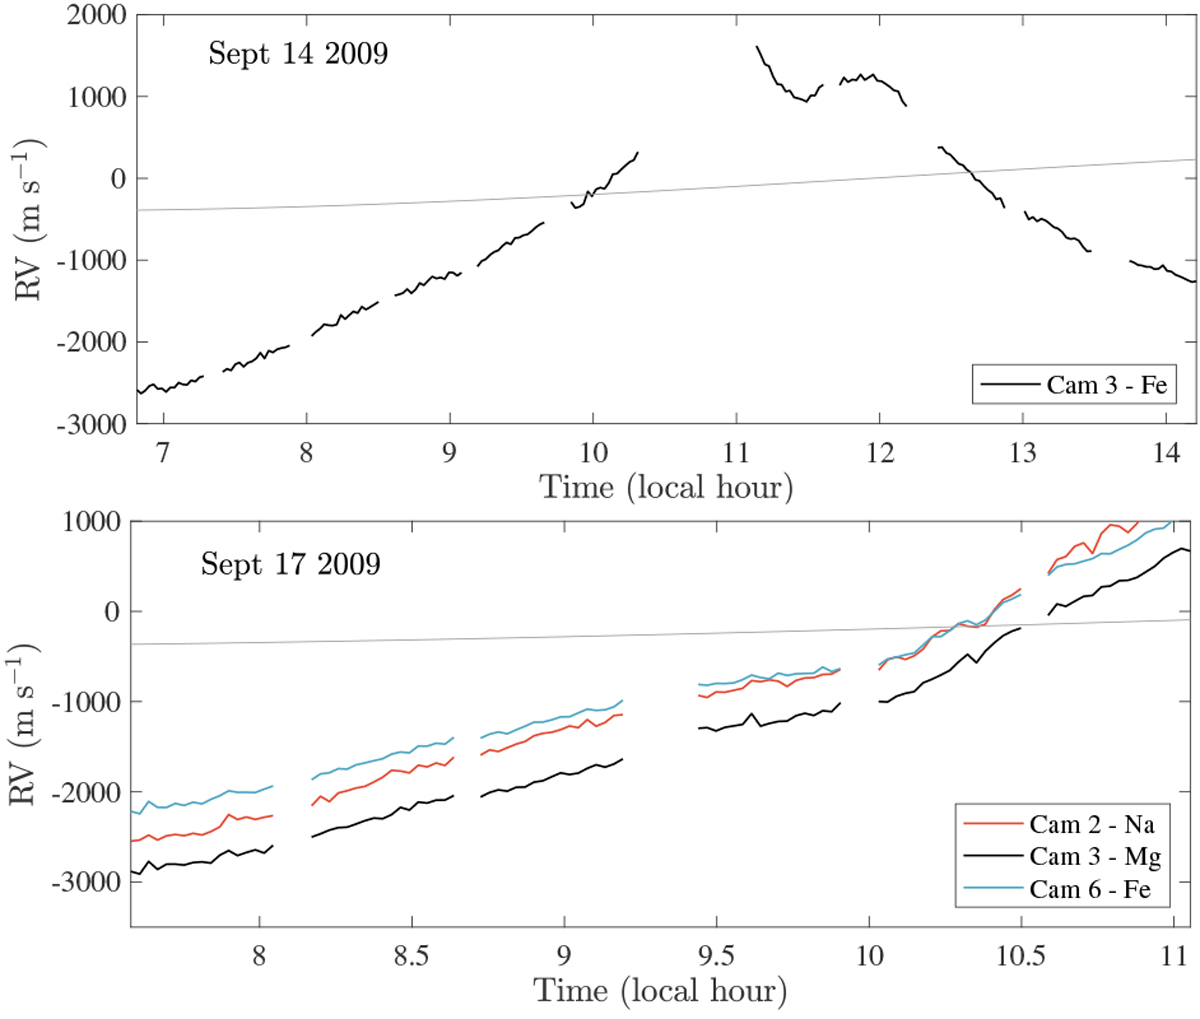
Mean RV of the Fraunhofer lines scattered by the Earth’s sky as functions of time. Each chunk (separated by empty spaces) corresponds to a scan. The first scan taken on September 14, 2009 is not shown as it was taken before sunrise. In both plots, the thin gray line represents the theoretical variation of the sky-scattered solar lines according to the ephemeris (Earth’s rotation essentially). The abbreviation “cam” refers to the CCD camera’s number.
Current usage metrics show cumulative count of Article Views (full-text article views including HTML views, PDF and ePub downloads, according to the available data) and Abstracts Views on Vision4Press platform.
Data correspond to usage on the plateform after 2015. The current usage metrics is available 48-96 hours after online publication and is updated daily on week days.
Initial download of the metrics may take a while.