Fig. 8.
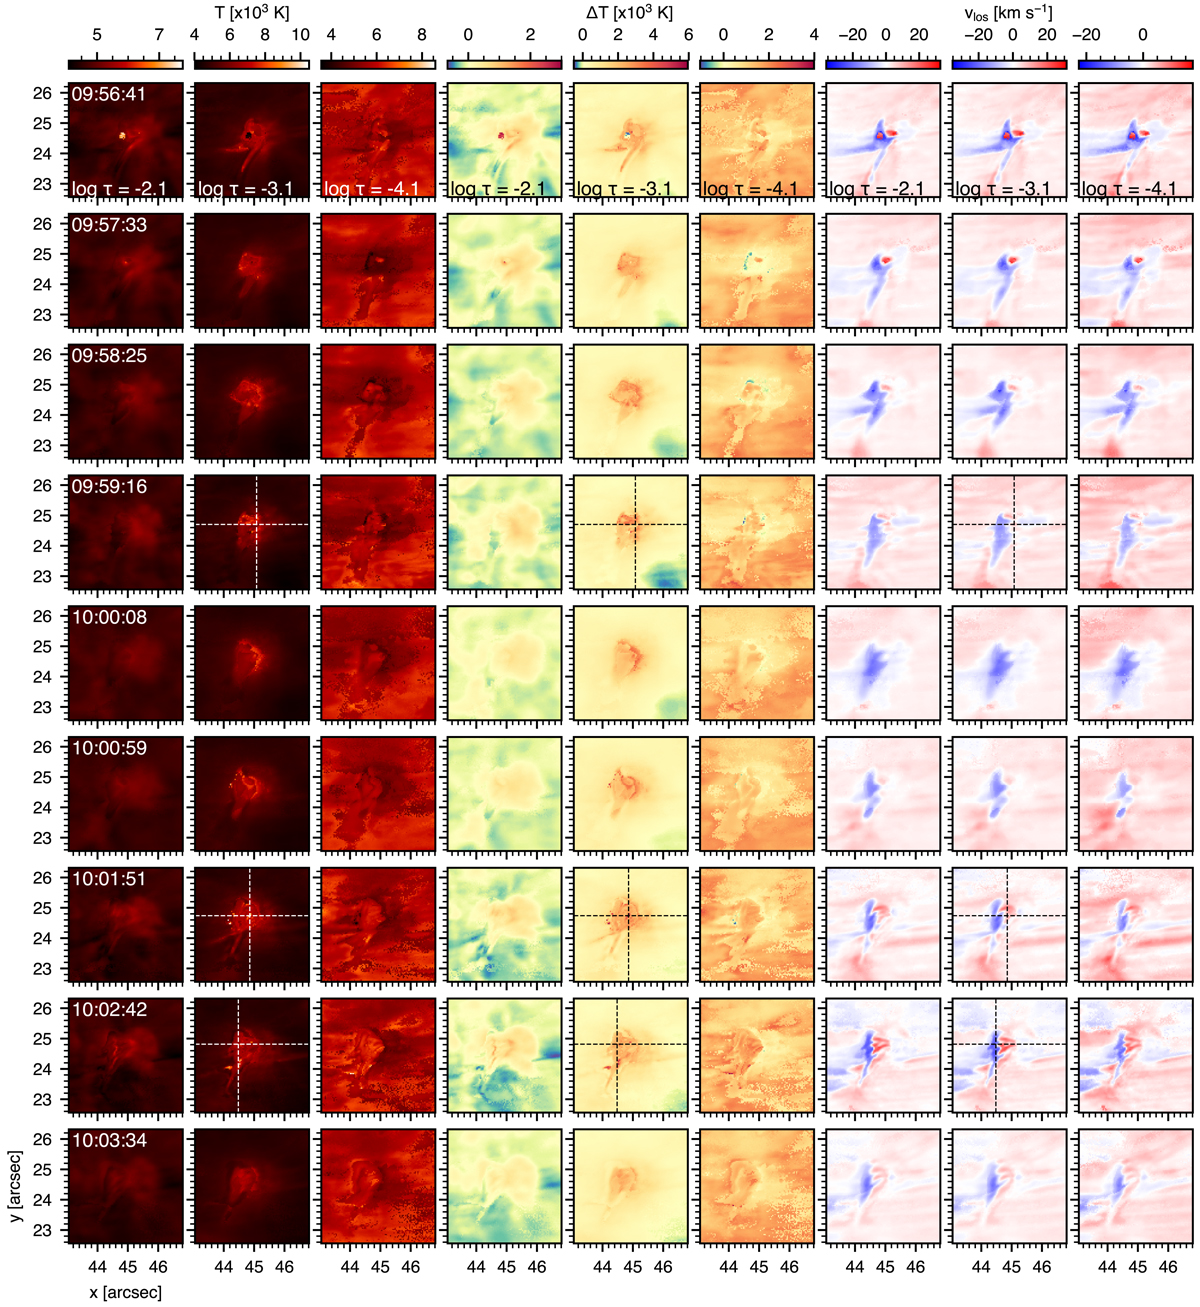
Time sequence of inversion maps of Event A from combining Ca II 8542 Å and Ca II K. From left to right the columns show temperature (left-most three columns), temperature difference with the input model (middle three columns), and line-of-sight velocity (right-most three columns) at the log τ500 heights specified in the first row panels. The time in UT is indicated in the top-left corner of the first panel of each row. The panels have been byte-scaled by column (ranges indicated by the colour bars at the top of each column). The dashed lines in rows 5, 8, and 9 indicate the lines along which Fig. 9 shows cross-cut inversion maps.
Current usage metrics show cumulative count of Article Views (full-text article views including HTML views, PDF and ePub downloads, according to the available data) and Abstracts Views on Vision4Press platform.
Data correspond to usage on the plateform after 2015. The current usage metrics is available 48-96 hours after online publication and is updated daily on week days.
Initial download of the metrics may take a while.