Fig. 7.
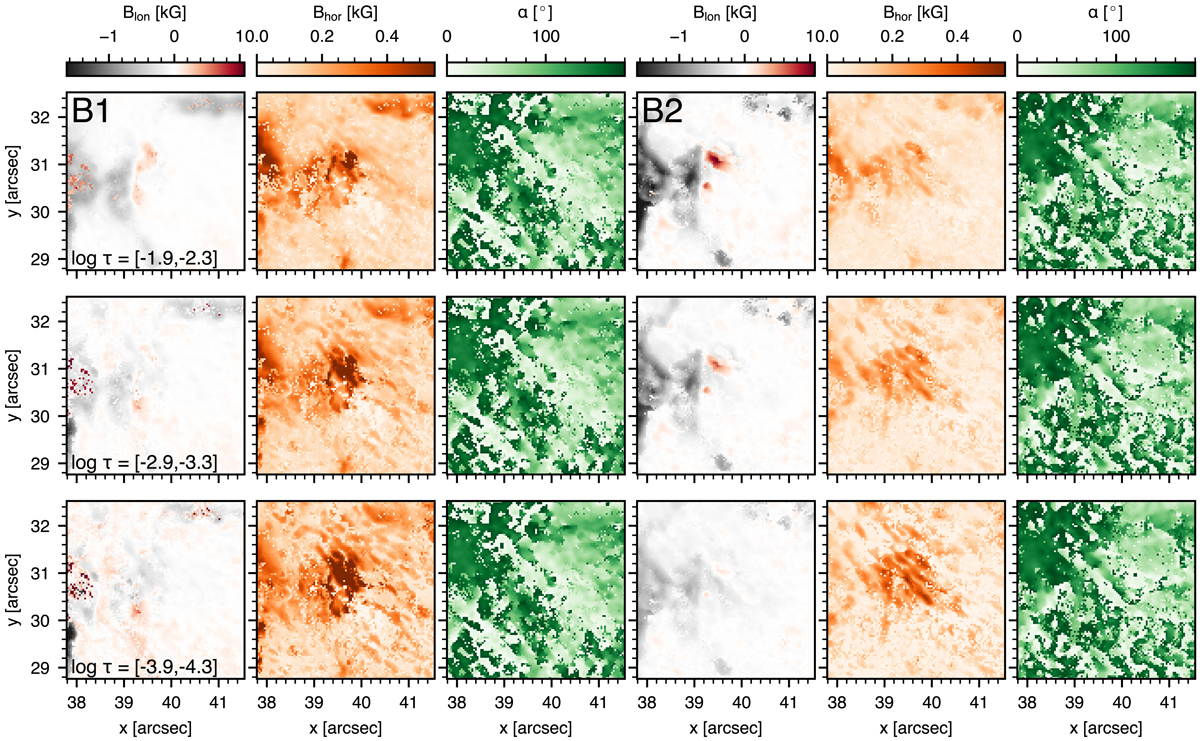
Inversion maps of magnetic field quantities for both Event B snapshots. From left to right: line-of-sight magnetic field strength (with positive/negative (i.e. red/black) corresponding to field oriented towards/away from the observer), horizontal magnetic field strength, and azimuth for Event B1, followed by similar maps for B2. As only one node was used in azimuth, the corresponding maps are identical for the three heights shown. The panels have been scaled by column to the same values for both B1 and B2 to facilitate comparison of the time evolution between them.
Current usage metrics show cumulative count of Article Views (full-text article views including HTML views, PDF and ePub downloads, according to the available data) and Abstracts Views on Vision4Press platform.
Data correspond to usage on the plateform after 2015. The current usage metrics is available 48-96 hours after online publication and is updated daily on week days.
Initial download of the metrics may take a while.