Fig. 6.
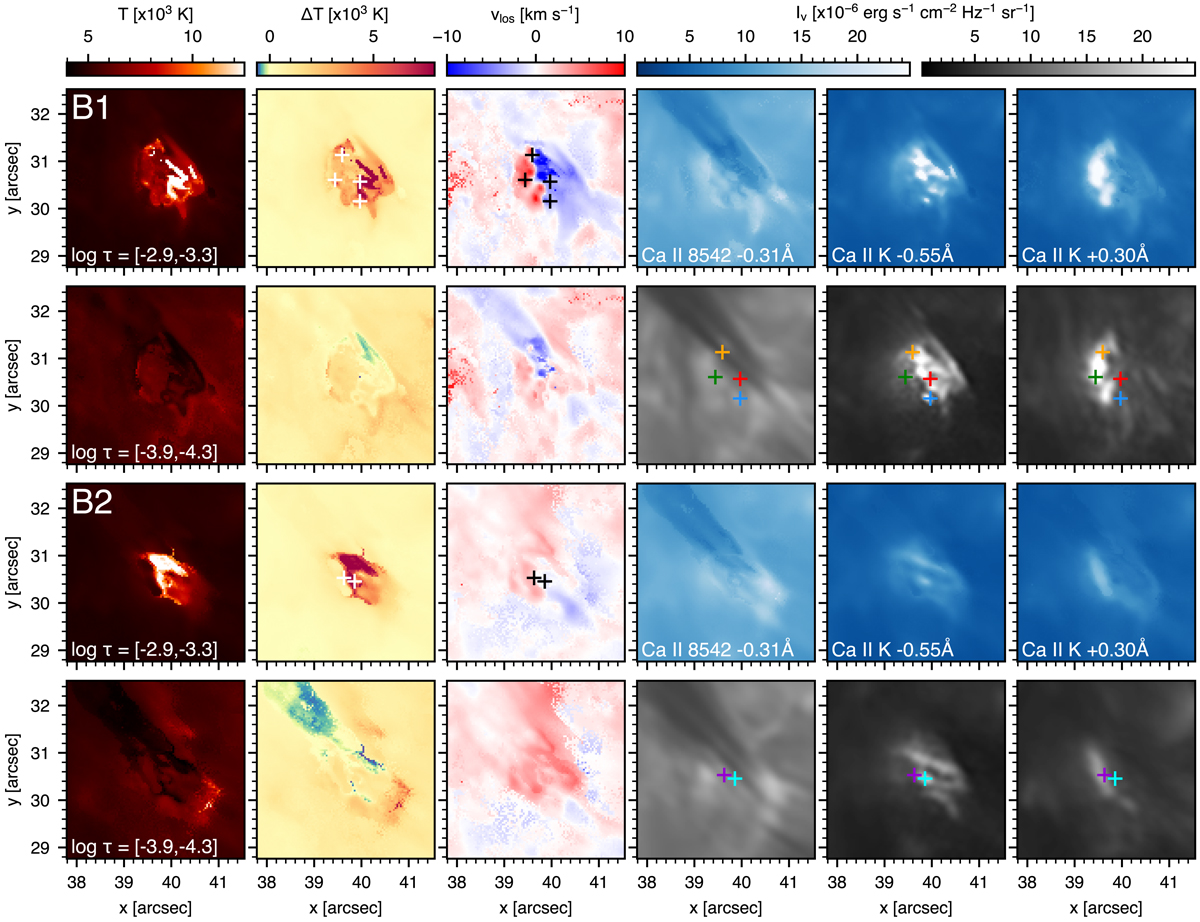
Inversion maps of Event B based on Ca II 8542 Å, Ca II K, and Fe I data, in a similar format to Fig. 4, but only showing maps at two heights for each of the Events B1 and B2. The top two rows (B1) show maps for the first snapshot of Event B in Fig. 2; bottom rows (B2): those for the second snapshot. The coloured plus symbols mark locations for which Ca II profiles are shown in the bottom two rows of Fig. 5. For the orange location in B1, Fig. 11 also shows Mg II profile fits.
Current usage metrics show cumulative count of Article Views (full-text article views including HTML views, PDF and ePub downloads, according to the available data) and Abstracts Views on Vision4Press platform.
Data correspond to usage on the plateform after 2015. The current usage metrics is available 48-96 hours after online publication and is updated daily on week days.
Initial download of the metrics may take a while.