Fig. 4.
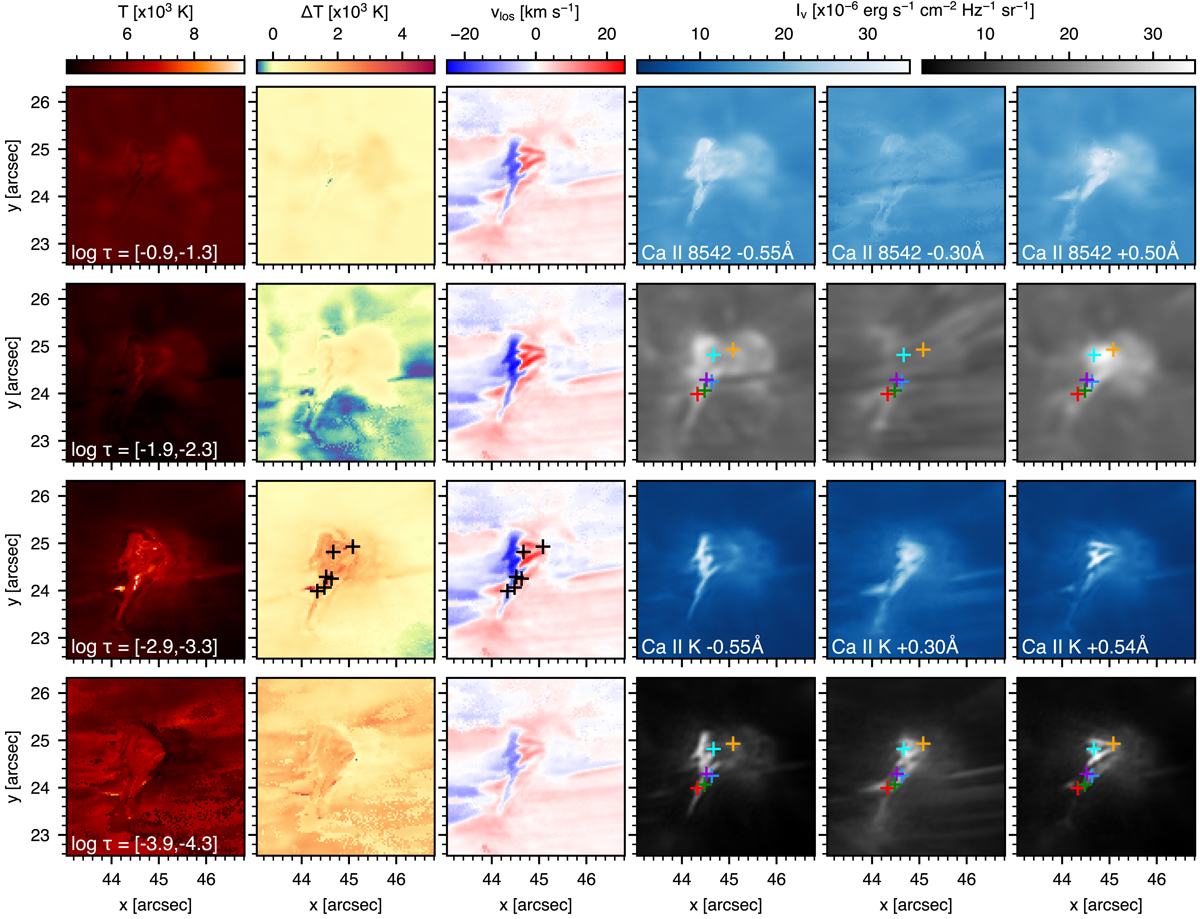
Inversion maps of Event A considering both Ca II 8542 Å and Ca II K. The same format is used as for Fig. 3, except that the right-hand panels in the lower two rows now show the synthetic and observed Ca II K intensity images (at the specified wavelength offsets) and those in the upper two rows (i.e. Ca II 8542 Å) have been multiplied by a factor 1.25 to offset the intrinsic intensity difference between both calcium lines. The coloured plus symbols in the right-hand column indicate the locations for which similarly coloured profiles are shown in Fig. 5. For reference, the same markers are overplotted on the third temperature difference and line-of-sight velocity maps (i.e. around log τ500 = −3.1), albeit in black for better visibility.
Current usage metrics show cumulative count of Article Views (full-text article views including HTML views, PDF and ePub downloads, according to the available data) and Abstracts Views on Vision4Press platform.
Data correspond to usage on the plateform after 2015. The current usage metrics is available 48-96 hours after online publication and is updated daily on week days.
Initial download of the metrics may take a while.