Fig. 3.
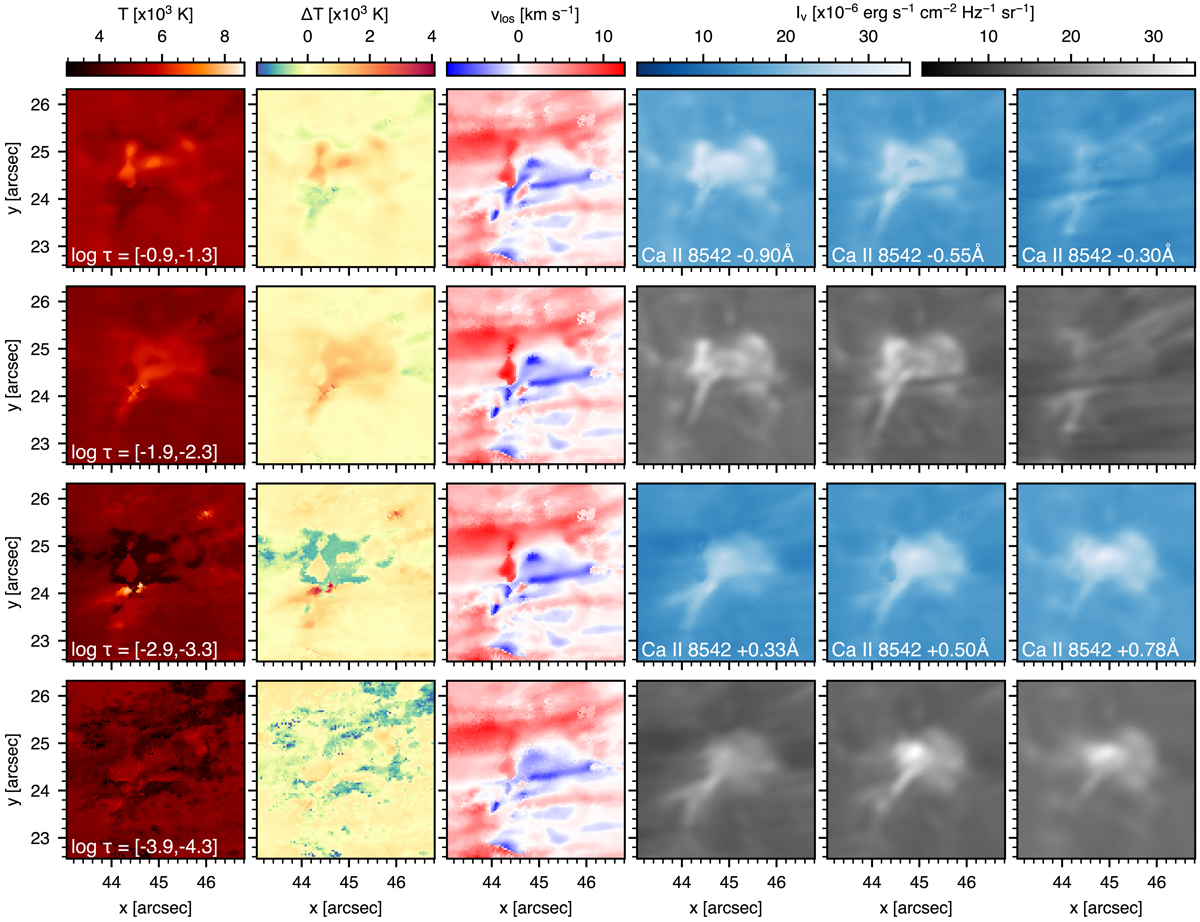
Inversion maps of the second snapshot of Event A (cf. Fig. 2, second row) from the Ca II 8542 Å-only run at several heights in the model atmosphere (three left-hand columns), as well as synthetic and observed intensity images for comparison (three right-hand columns). From left to right: temperature, temperature difference with respect to the initial input model, line-of-sight velocity, and synthetic (first and third rows) and observed (second and fourth rows) intensity images in the wings of Ca II 8542 Å at the wavelength offsets indicated in the synthetic image panels. The log τ500 height for each row is indicated in the lower-left corner of the left-most panels. Panels are scaled by column for the three left-hand columns, while all panels in the three right-hand columns are scaled to the same values, i.e. similar colours in different panels mean similar values at different heights or wavelength offsets. The intensity panels have been multiplied by 1.25 to offset absolute intensity differences with Ca II K, allowing direct comparison with the Ca II 8542 Å panels in Figs. 4 and 10.
Current usage metrics show cumulative count of Article Views (full-text article views including HTML views, PDF and ePub downloads, according to the available data) and Abstracts Views on Vision4Press platform.
Data correspond to usage on the plateform after 2015. The current usage metrics is available 48-96 hours after online publication and is updated daily on week days.
Initial download of the metrics may take a while.