Fig. 2.
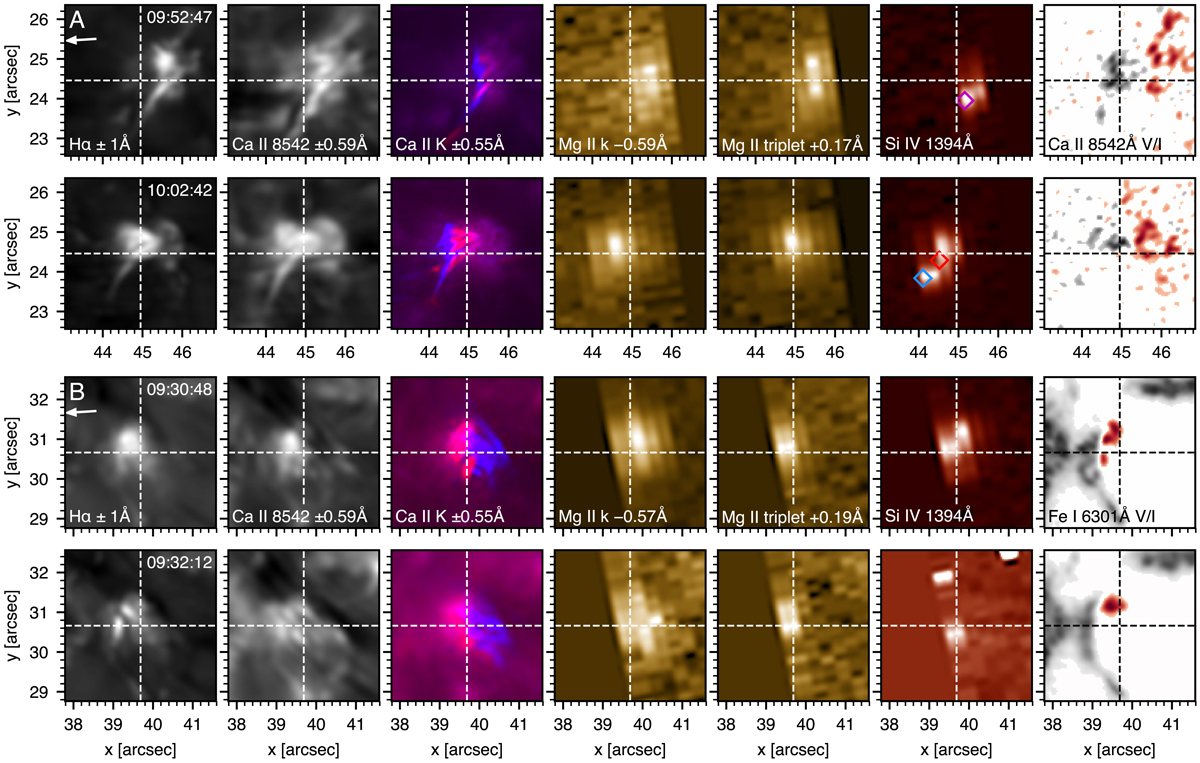
Close-up images of the selected events in the various diagnostics in which they are observed. From left to right: Hα summed wings (±1 Å), Ca II 8542 Å summed wings (±0.59 Å), composite Ca II K images at the indicated wavelength offsets (with blue wing in blue, red wing in red), Mg II k blue wing, Mg II triplet red wing, Si IV (nominal rest wavelength) and a Stokes V/I magnetogram proxy (from Ca II 8542 Å for September 3 and Fe I 6301.5 Å at −0.07 Å for September 5), with positive and negative polarities in black and red, respectively. For each event – labelled in the top-left corner of the Hα panel – two snapshots are shown at the times specified in the top right corner of the same panel. The white arrows below the event labels indicate the direction to the closest limb. The dashed cross-hairs do not highlight any particular feature, but are meant to aid in comparing the substructure in various diagnostics. The coloured diamonds in the Si IV panels of Event A (second-to-last panels in the top two rows) indicate locations for which spectra and inversion results are shown in Fig. 12. Panels have been byte-scaled individually to better highlight relevant substructure.
Current usage metrics show cumulative count of Article Views (full-text article views including HTML views, PDF and ePub downloads, according to the available data) and Abstracts Views on Vision4Press platform.
Data correspond to usage on the plateform after 2015. The current usage metrics is available 48-96 hours after online publication and is updated daily on week days.
Initial download of the metrics may take a while.