Fig. A.4.
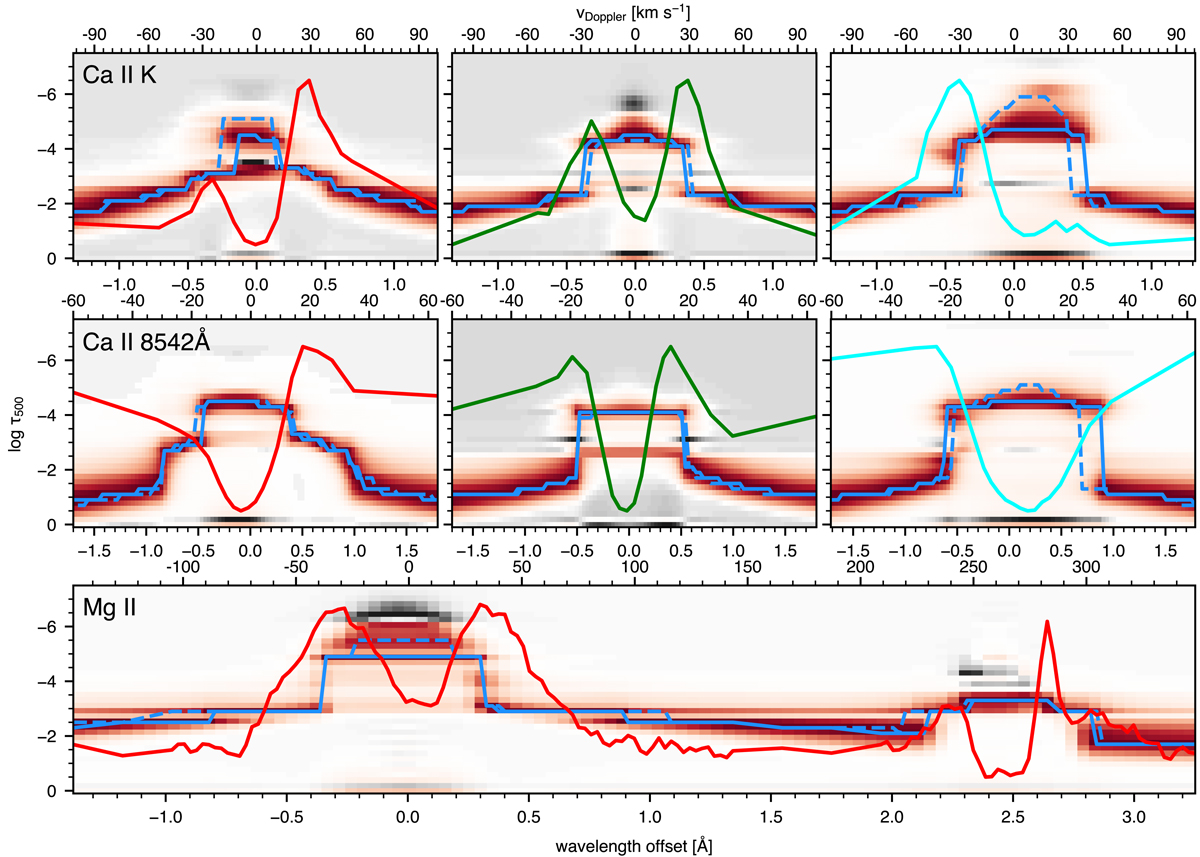
Response functions to temperature with log τ500 as function of wavelength in Ca II K (top row), Ca II 8542 Å (middle row) and Mg II (bottom panel) for three of the selected pixels from Figs. A.1 and A.2. Results are shown for the red sampling (first column and bottom panel) and green sampling (second column) of event A, and the cyan sampling of event B (third column), under the assumption of non-LTE hydrogen ionisation. Corresponding observed Ca II and Mg II profiles are shown for reference and have been plotted on arbitrary scale to maximise visiblity of profile features. In each panel the response function is displayed in red-white-black colour scale (with red being positive response, black negative and white none), at each wavelength normalised to its maximum with height log τ500. The blue lines indicate the log τ500 heights as function of wavelength for which the response function peaks in the case of LTE (dashed) and non-LTE (solid) electron densities.
Current usage metrics show cumulative count of Article Views (full-text article views including HTML views, PDF and ePub downloads, according to the available data) and Abstracts Views on Vision4Press platform.
Data correspond to usage on the plateform after 2015. The current usage metrics is available 48-96 hours after online publication and is updated daily on week days.
Initial download of the metrics may take a while.