Fig. A.2.
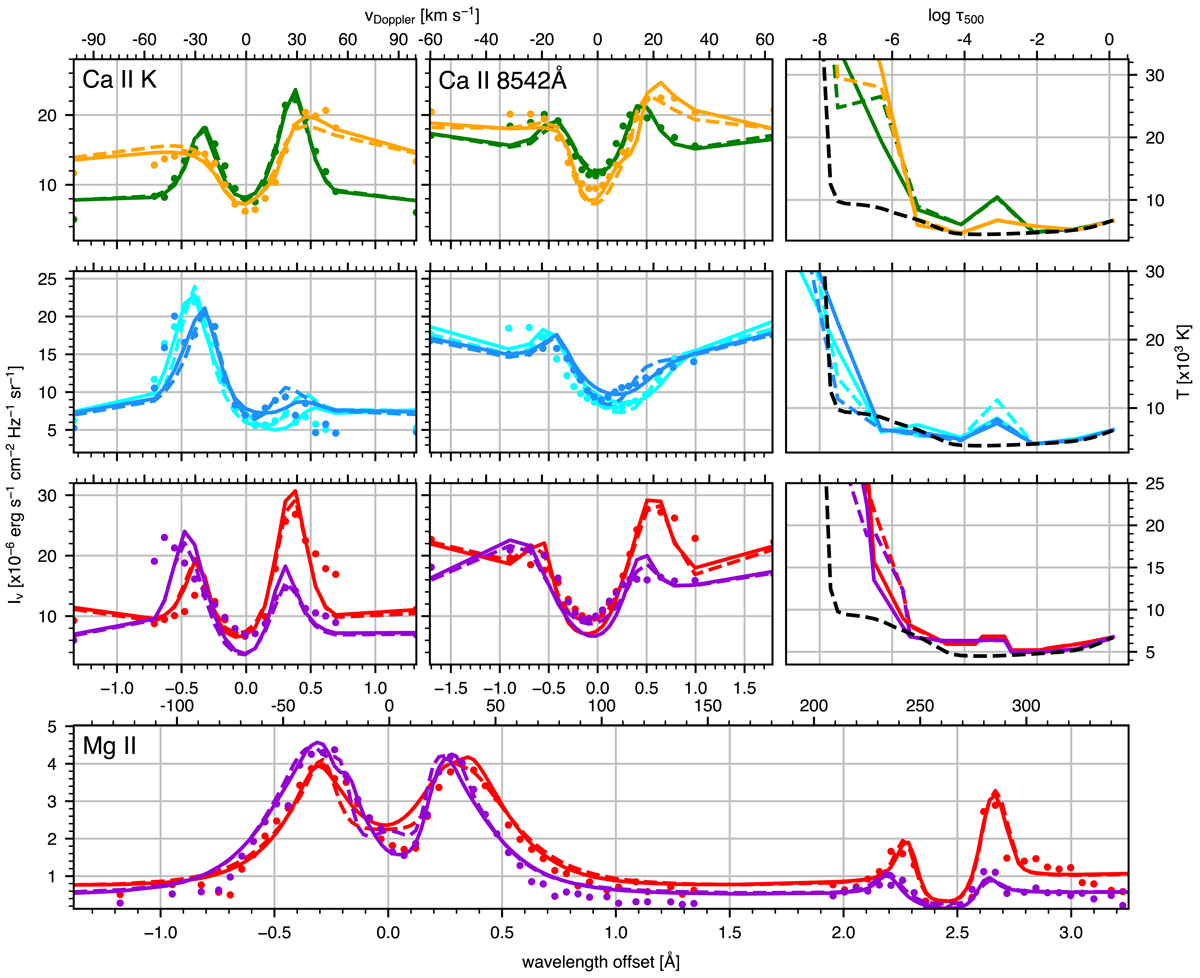
Spectral line and temperature profiles for six selected pixels in Events A (top and bottom two rows) and B (second row) at the identically coloured locations marked in Fig. A.1. The left-hand, middle, and bottom panels show fits assuming hydrogen ionisation in LTE (dashed lines) and non-LTE (solid lines) to the observed profiles (filled circles) for Ca II K (left panel in the first three rows), Ca II 8542 Å (middle panel in the same rows), and Mg II (bottom panel). The corresponding temperature stratification (right-hand panels) is shown using the same colour coding, along with the FAL-C input temperature for reference (dashed black line).
Current usage metrics show cumulative count of Article Views (full-text article views including HTML views, PDF and ePub downloads, according to the available data) and Abstracts Views on Vision4Press platform.
Data correspond to usage on the plateform after 2015. The current usage metrics is available 48-96 hours after online publication and is updated daily on week days.
Initial download of the metrics may take a while.