Fig. A.1.
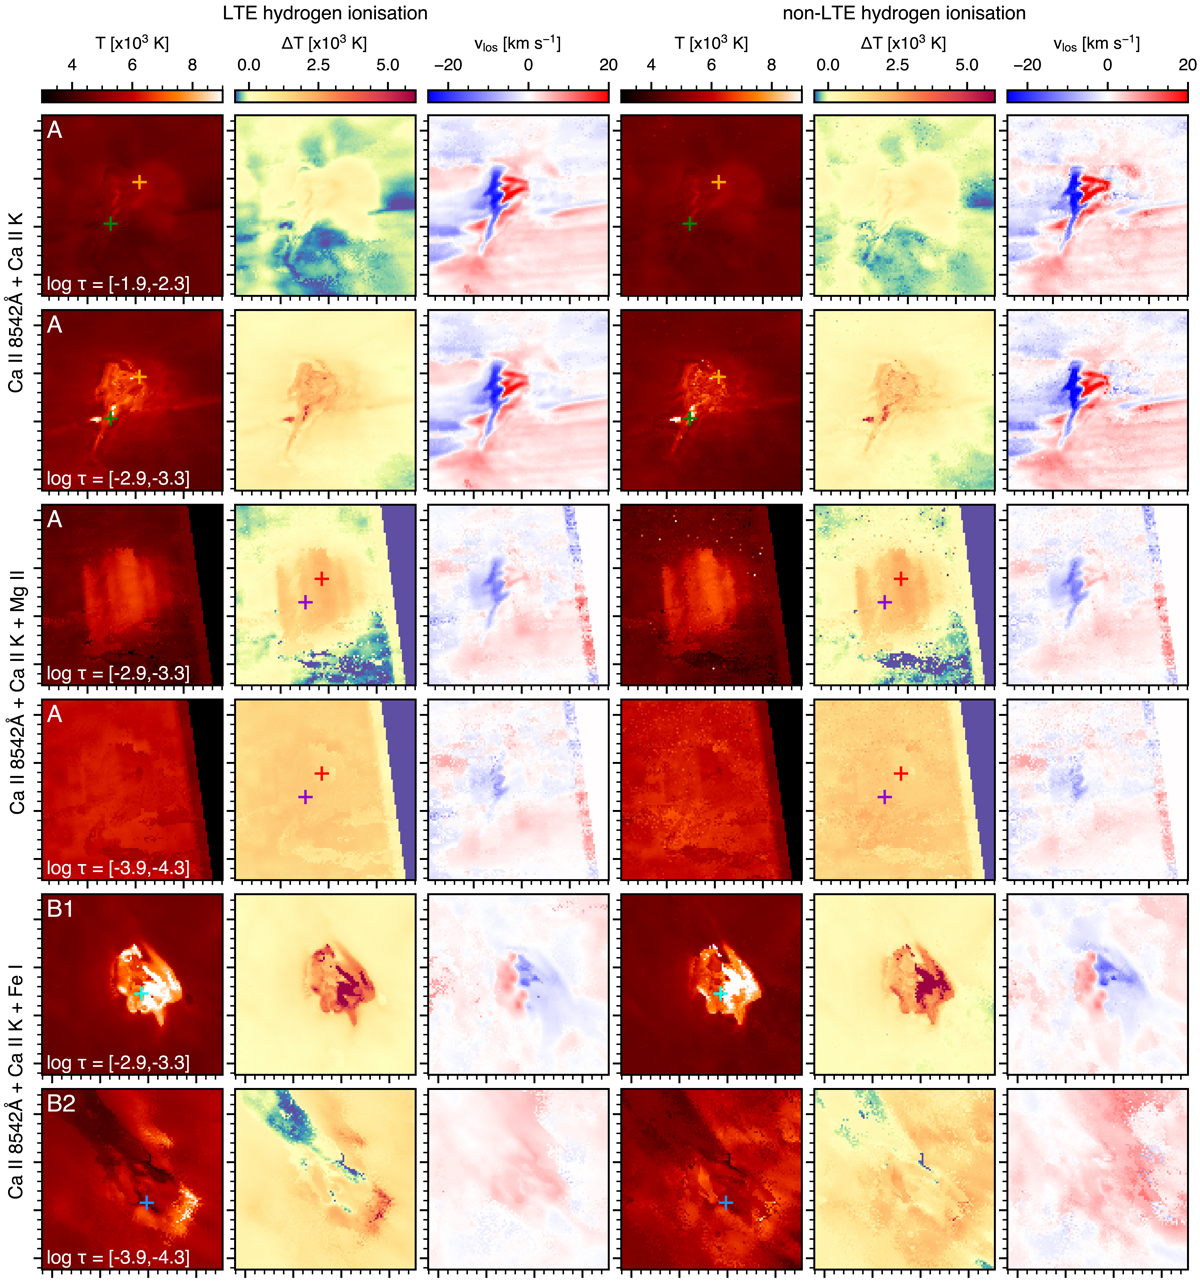
Inversion maps assuming hydrogen ionisation in LTE (three left-hand columns) and in non-LTE (three right-hand columns). Each set of columns has the same format as the three left-hand columns of e.g. Fig. 4, showing from left to right the temperature, the temperature difference to the input FAL-C temperature, and the line-of-sight velocity. The maps correspond to inversions combining Ca II 8542 Å and Ca II K for event A (top two rows), Ca II and Mg II for the same event (middle two rows), and Ca II and Fe I for event B (bottom two rows). Coloured markers correspond to pixels for which detailed profiles are shown in Fig. A.2 and are overlaid in the first and third columns (except for the middle two rows where they have been overlaid in the second and fourth column panels instead for better visibility). These sampling locations are the same as the identically coloured locations in Figs. 4 (top two rows), 10 (middle two rows), and 6 (bottom two rows). Major tick marks are spaced 1″ apart for all panels.
Current usage metrics show cumulative count of Article Views (full-text article views including HTML views, PDF and ePub downloads, according to the available data) and Abstracts Views on Vision4Press platform.
Data correspond to usage on the plateform after 2015. The current usage metrics is available 48-96 hours after online publication and is updated daily on week days.
Initial download of the metrics may take a while.