Fig. 13.
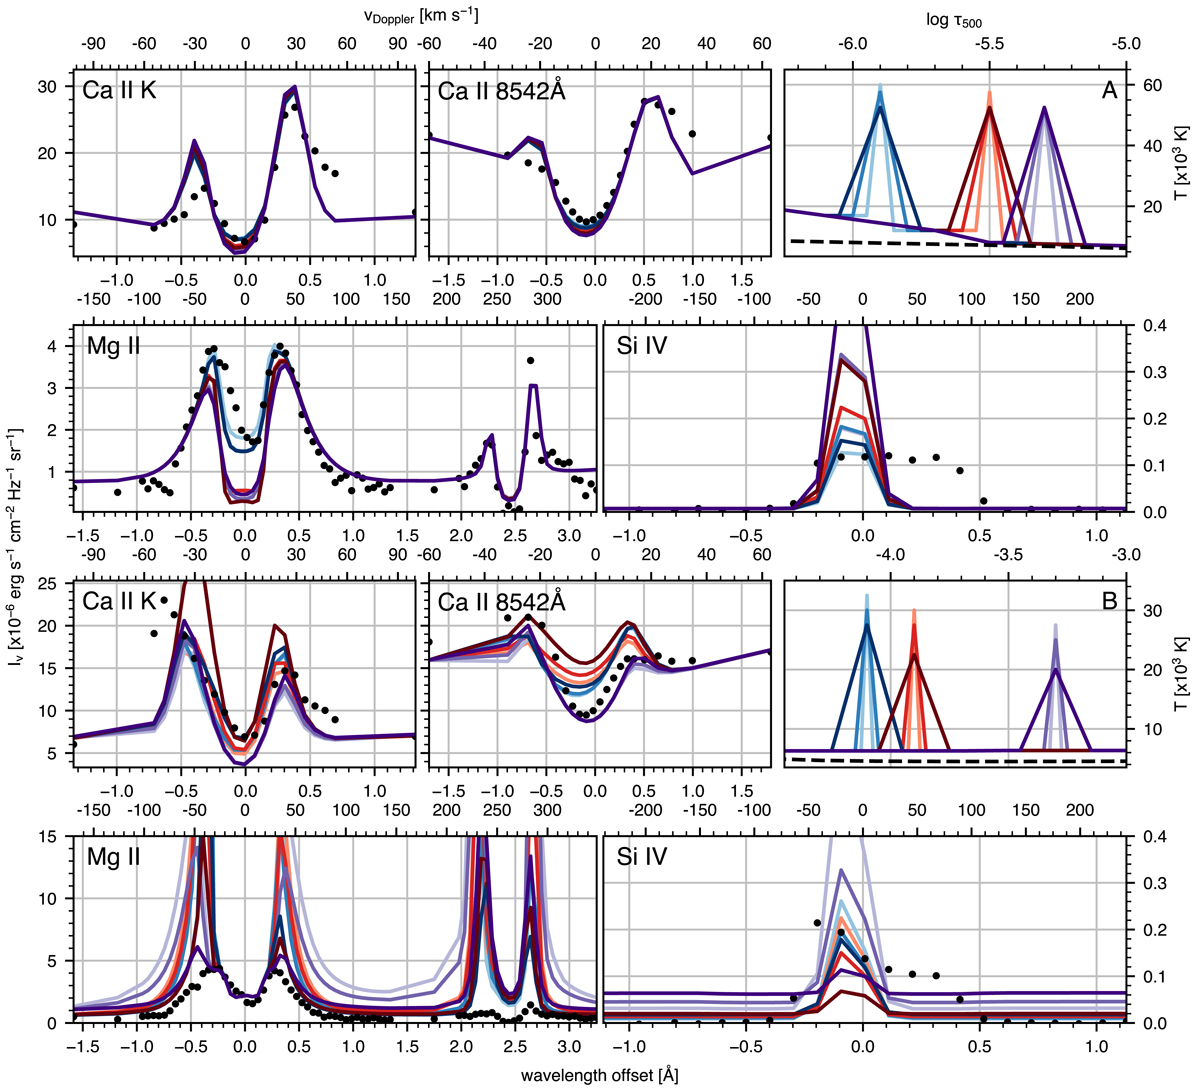
Spectral synthesis of Ca II, Mg II, and Si IV based on modified inversion atmospheres of two well-fitted pixels of Event A. Temperature peaks have been added at three log τ500 heights (differentiated by colour) with various peak heights and base widths (differentiated by colour shades, increasingly darker for increasing width and/or decreasing peak height). Subfigure A (top two rows) shows the results for placing such enhancement of log τ500-width 0.1–0.3 (from light to dark shade) somewhere between log τ500 = −5.9 and −4.9. Subfigure B (bottom two rows) offers a similar display for spikes of log τ500-width 0.05, 0.1, and 0.3 (from light to dark) at heights between log τ500 = −4.1 and −3.1. The underlying observations are from different pixels for the two subfigures. Each subfigure has a similar format to Fig. 12, with the spectral panels showing the observations as black dotted profiles and synthesis output as coloured solid lines.
Current usage metrics show cumulative count of Article Views (full-text article views including HTML views, PDF and ePub downloads, according to the available data) and Abstracts Views on Vision4Press platform.
Data correspond to usage on the plateform after 2015. The current usage metrics is available 48-96 hours after online publication and is updated daily on week days.
Initial download of the metrics may take a while.