Fig. 12.
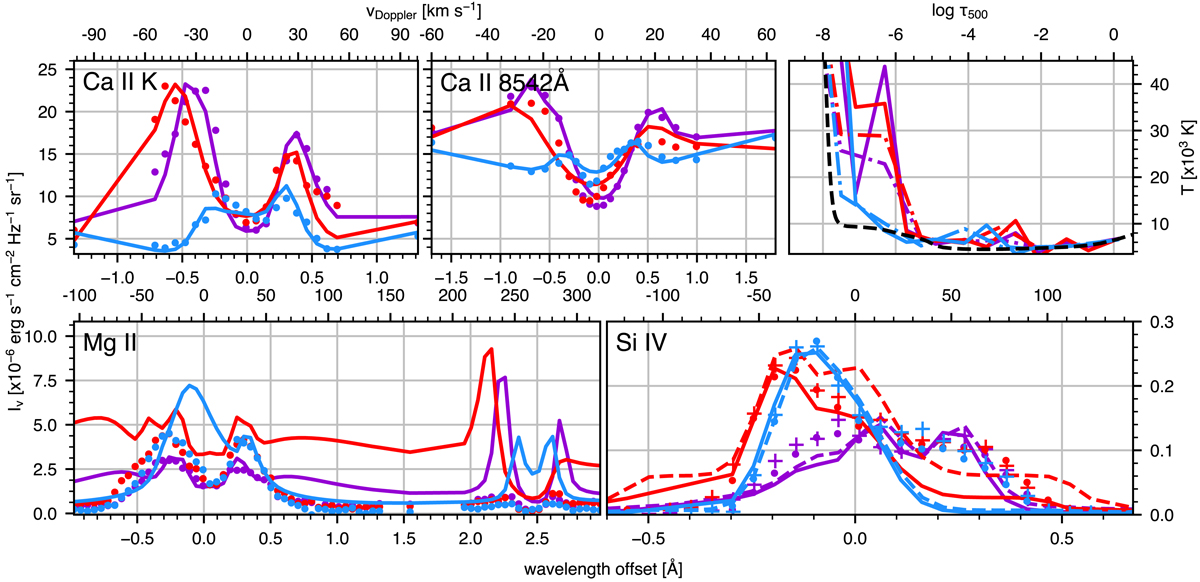
Observed and inverted Ca II 8542 Å, Ca II K, Mg II, and Si IV profiles, as well as the corresponding temperature stratification, for selected pixels in Event A (highlighted with diamond markers in Fig. 10 for the red and blue profiles; the purple profiles correspond to a pixel in the middle of the Si IV brightening in the earlier Event A snapshot shown in the top row of Fig. 2). The format is similar to that of Fig. 11, except that the lower row contains an additional panel with the Si IV 1394 Å (1403 Å) line, where the observed profiles are shown as dots (plus markers) and the fits as solid (dashed) lines. The observational and synthetic Si IV 1403 Å data have been multiplied by two to offset the intrinsic intensity difference with 1394 Å under optically thin conditions. The temperature profile panel also includes dash-dotted lines for each sampling indicating the result from the previous inversion cycle (i.e. SST data only).
Current usage metrics show cumulative count of Article Views (full-text article views including HTML views, PDF and ePub downloads, according to the available data) and Abstracts Views on Vision4Press platform.
Data correspond to usage on the plateform after 2015. The current usage metrics is available 48-96 hours after online publication and is updated daily on week days.
Initial download of the metrics may take a while.