Fig. 11.
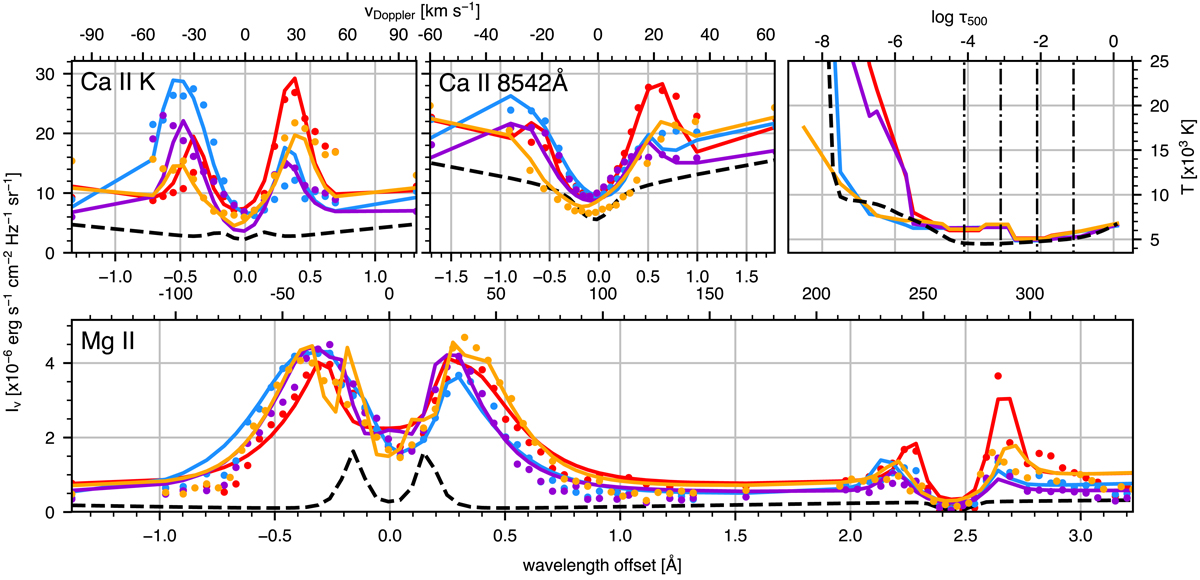
Ca II K, Ca II 8542 Å, Mg II and temperature profiles for selected pixels in event A (red, blue and purple) and Event B (orange) at the similarly coloured locations marked in the right-hand panels of Figs. 10 and 6, respectively. The format is similar to that in Fig. 5, except that the second row now shows the Mg II k and Mg II triplet lines (the zoom-in has been chosen such to allow easier comparison of the observed and inverted profiles, omitting Mg II h because it behaves similarly to Mg II k). The input observed Mg II profiles are shown with every other point to avoid cluttering the plot.
Current usage metrics show cumulative count of Article Views (full-text article views including HTML views, PDF and ePub downloads, according to the available data) and Abstracts Views on Vision4Press platform.
Data correspond to usage on the plateform after 2015. The current usage metrics is available 48-96 hours after online publication and is updated daily on week days.
Initial download of the metrics may take a while.