Fig. 10.
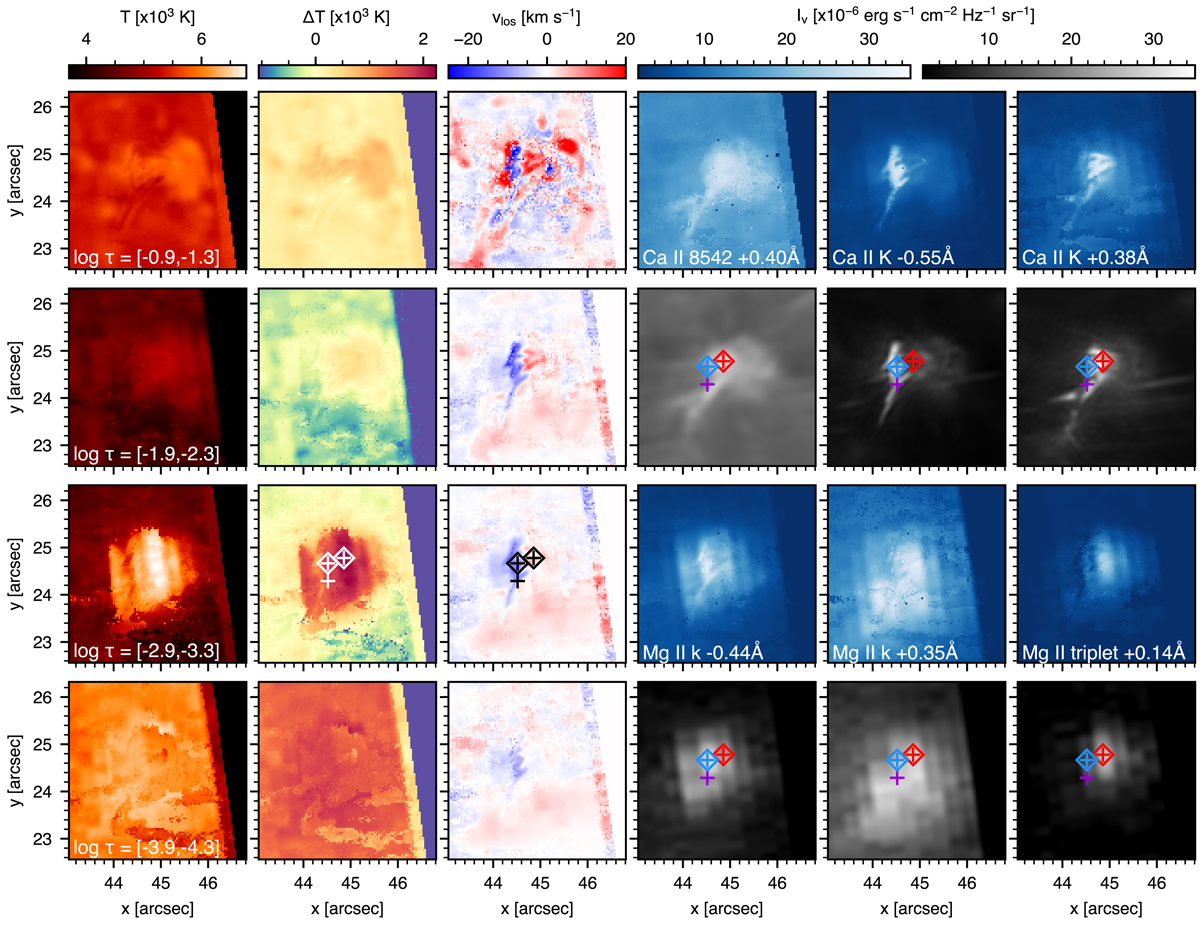
Inversion maps of Event A considering both Ca II lines and Mg II h & k. The format is as in Fig. 4, except that the six panels in the lower right now show (from left to right) an image of the Mg II k2V, k2R, and the red wing of the subordinate Mg II triplet. The Ca II 8542 Å, Mg II k, and Mg II triplet images have been multiplied by 1.25, 7.5, and 10, respectively, to roughly offset the intrinsic intensity difference with the Ca II K line and all panels in the three right-hand columns have subsequently been scaled to the same values (these are the same values as in Figs. 3 and 4). The triangular area to the (upper) right of the inversion maps has values set to zero as these fall outside the IRIS raster. The coloured plus symbols in the second and fourth rows mark the locations for which profiles are shown in the top two rows of Fig. 11; the coloured diamond symbols mark those locations for which Fig. 12 shows profile fits including Si IV. The purple cross marks the same location as the purple cross in Fig. 4.
Current usage metrics show cumulative count of Article Views (full-text article views including HTML views, PDF and ePub downloads, according to the available data) and Abstracts Views on Vision4Press platform.
Data correspond to usage on the plateform after 2015. The current usage metrics is available 48-96 hours after online publication and is updated daily on week days.
Initial download of the metrics may take a while.