Free Access
Fig. 9.
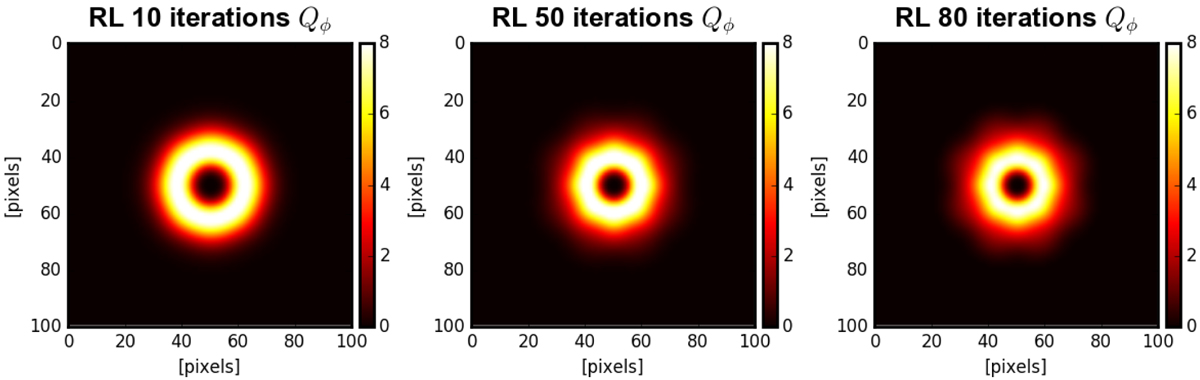
Deconvolution of intensity images of the uniform disk convolved with the Gaussian PSF. The deconvolved Qϕ images are shown after 10, 50, and 80 iterations; Uϕ is not shown because of the small signal levels. All images are scaled with r2 owing to the high dynamic range created by the intensity drop-off.
Current usage metrics show cumulative count of Article Views (full-text article views including HTML views, PDF and ePub downloads, according to the available data) and Abstracts Views on Vision4Press platform.
Data correspond to usage on the plateform after 2015. The current usage metrics is available 48-96 hours after online publication and is updated daily on week days.
Initial download of the metrics may take a while.