Fig. 7.
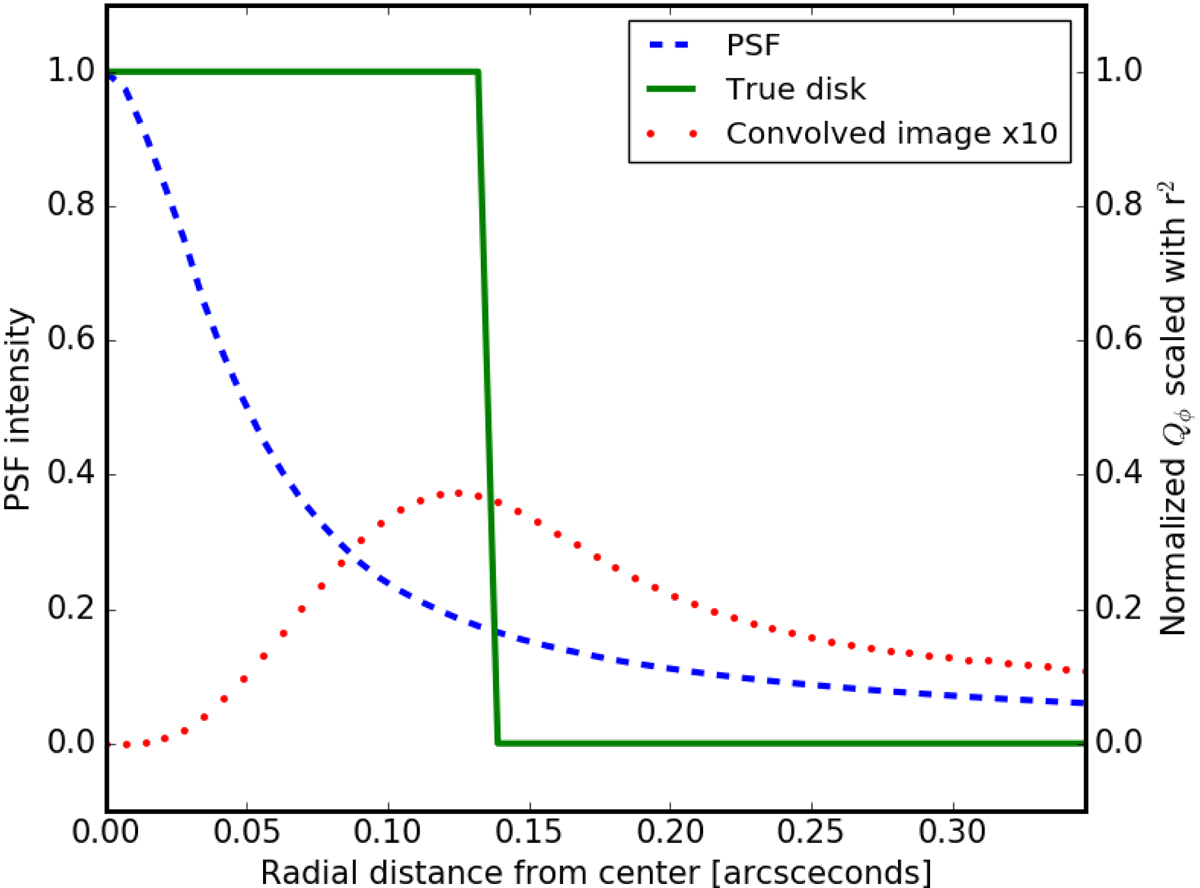
Educational example of PSF depolarization on convolved images due to a reference SPHERE/ZIMPOL PSF. The cross sections of uniform, face-on disk. Green, solid line: the original polarized disk signal. Blue, dashed line: the SPHERE/ZIMPOL PSF in R band as shown in Fig. 6. Red dotted line: the polarization signal after convolution with the SPHERE/ZIMPOL PSF in R band.
Current usage metrics show cumulative count of Article Views (full-text article views including HTML views, PDF and ePub downloads, according to the available data) and Abstracts Views on Vision4Press platform.
Data correspond to usage on the plateform after 2015. The current usage metrics is available 48-96 hours after online publication and is updated daily on week days.
Initial download of the metrics may take a while.