Free Access
Fig. 1.
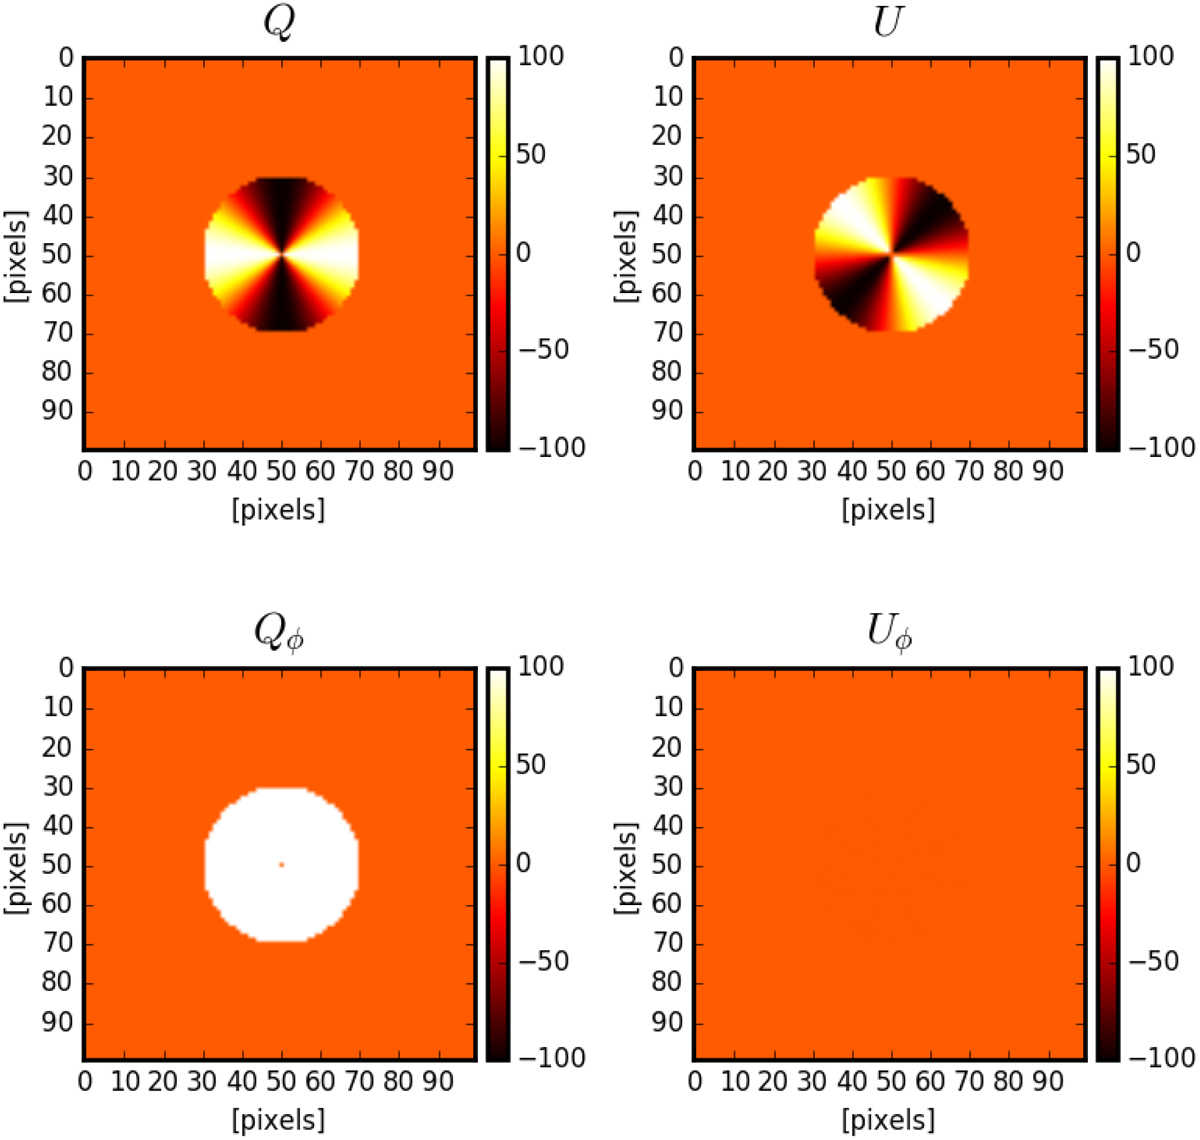
Simulated images of a uniform, face-on disk in Q, U, Qϕ, and Uϕ. All images are scaled with r2 owing to the high dynamic range created by the intensity drop-off. We note that the scale goes to ±100; we multiplied the intensity value from Eq. (1) by 100.
Current usage metrics show cumulative count of Article Views (full-text article views including HTML views, PDF and ePub downloads, according to the available data) and Abstracts Views on Vision4Press platform.
Data correspond to usage on the plateform after 2015. The current usage metrics is available 48-96 hours after online publication and is updated daily on week days.
Initial download of the metrics may take a while.