Fig. 7.
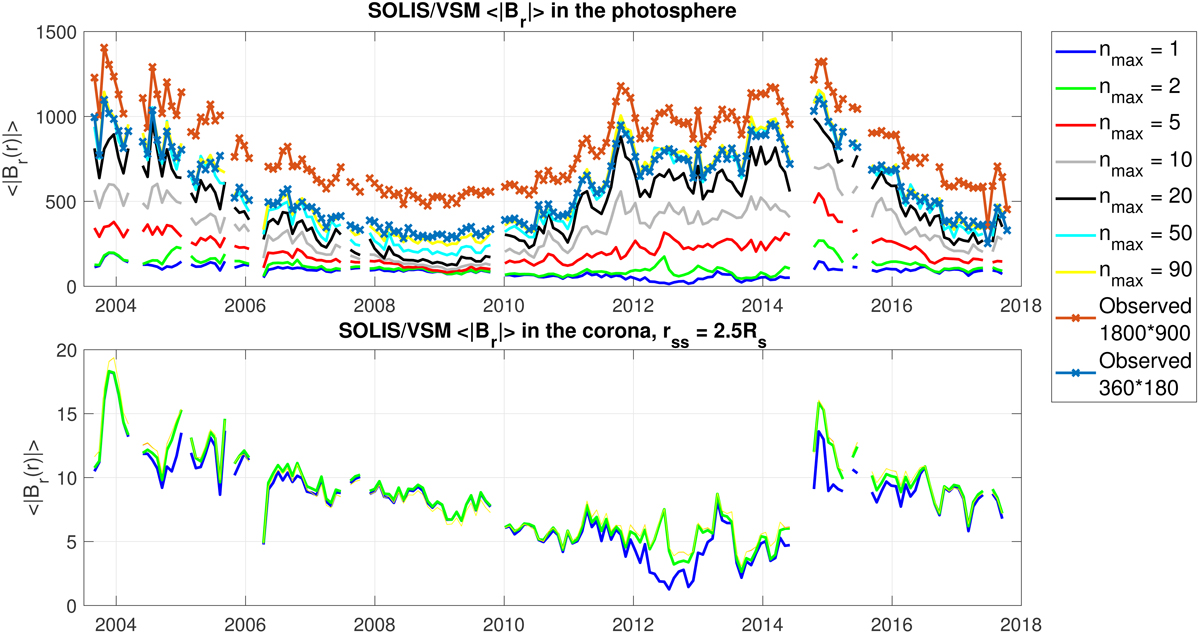
Dependence of mean photospheric and coronal magnetic flux density ⟨|Br(r)|⟩ on nmax. Upper panel: rotational values of ⟨|Br(r)|⟩ in the photosphere (r = Rs) with nmax = 1, 2, 5, 10, 20, 50, 90 and the observed values from synoptic maps of 1800*900 and 360*180 pixels, respectively. Lower panel: ⟨|Br(r)|⟩ in the coronal source surface (rss = 2.5RS) using the same values of nmax as in the upper panel.
Current usage metrics show cumulative count of Article Views (full-text article views including HTML views, PDF and ePub downloads, according to the available data) and Abstracts Views on Vision4Press platform.
Data correspond to usage on the plateform after 2015. The current usage metrics is available 48-96 hours after online publication and is updated daily on week days.
Initial download of the metrics may take a while.