Fig. 5.
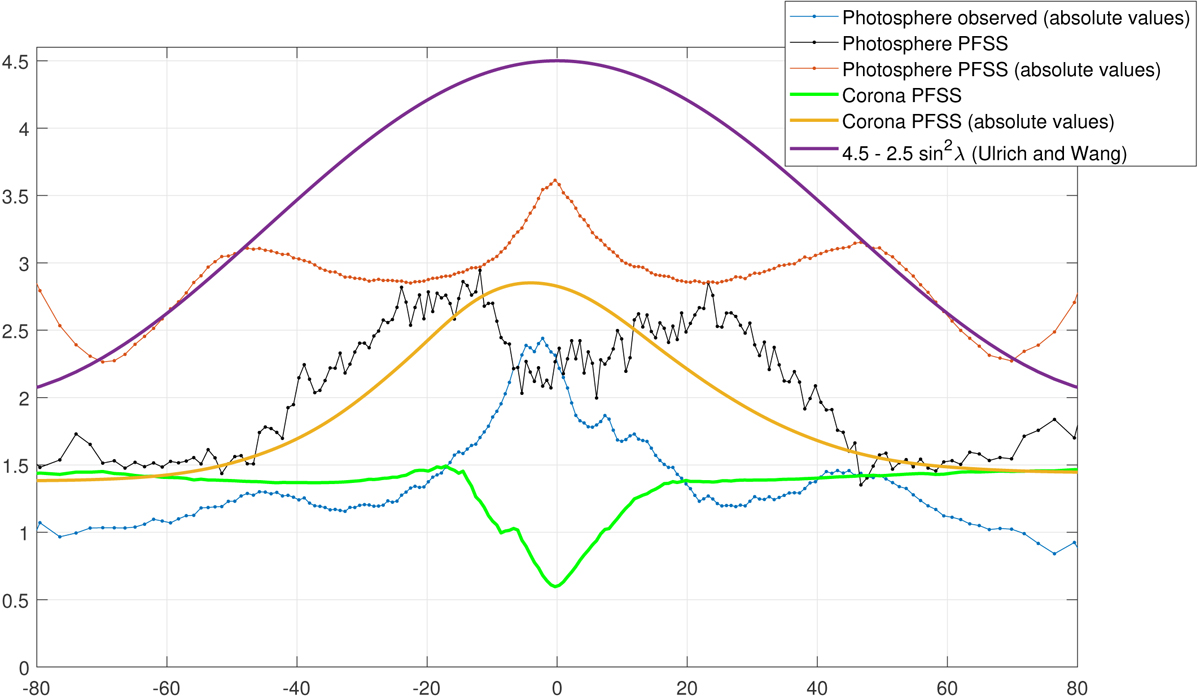
Latitude variation of the effective scaling factors from MWO to SOLIS/VSM for photospheric and coronal fields. The blue curve is the ratio of averages of rotational means of absolute values observed by SOLIS/VSM and MWO over the overlapping period of two instruments in 2003–2013. The black (green) curve shows the ratio between scaled and nonscaled means of longitudinally averaged photospheric (coronal) PFSS magnetic fields. The red (yellow) curve shows the ratio between scaled and nonscaled means of longitudinally averaged absolute values of the photospheric (coronal) PFSS magnetic fields. The purple curve is the latitudinal scaling factor by Ulrich (1992) and Wang & Sheeley (1995).
Current usage metrics show cumulative count of Article Views (full-text article views including HTML views, PDF and ePub downloads, according to the available data) and Abstracts Views on Vision4Press platform.
Data correspond to usage on the plateform after 2015. The current usage metrics is available 48-96 hours after online publication and is updated daily on week days.
Initial download of the metrics may take a while.