Fig. 1
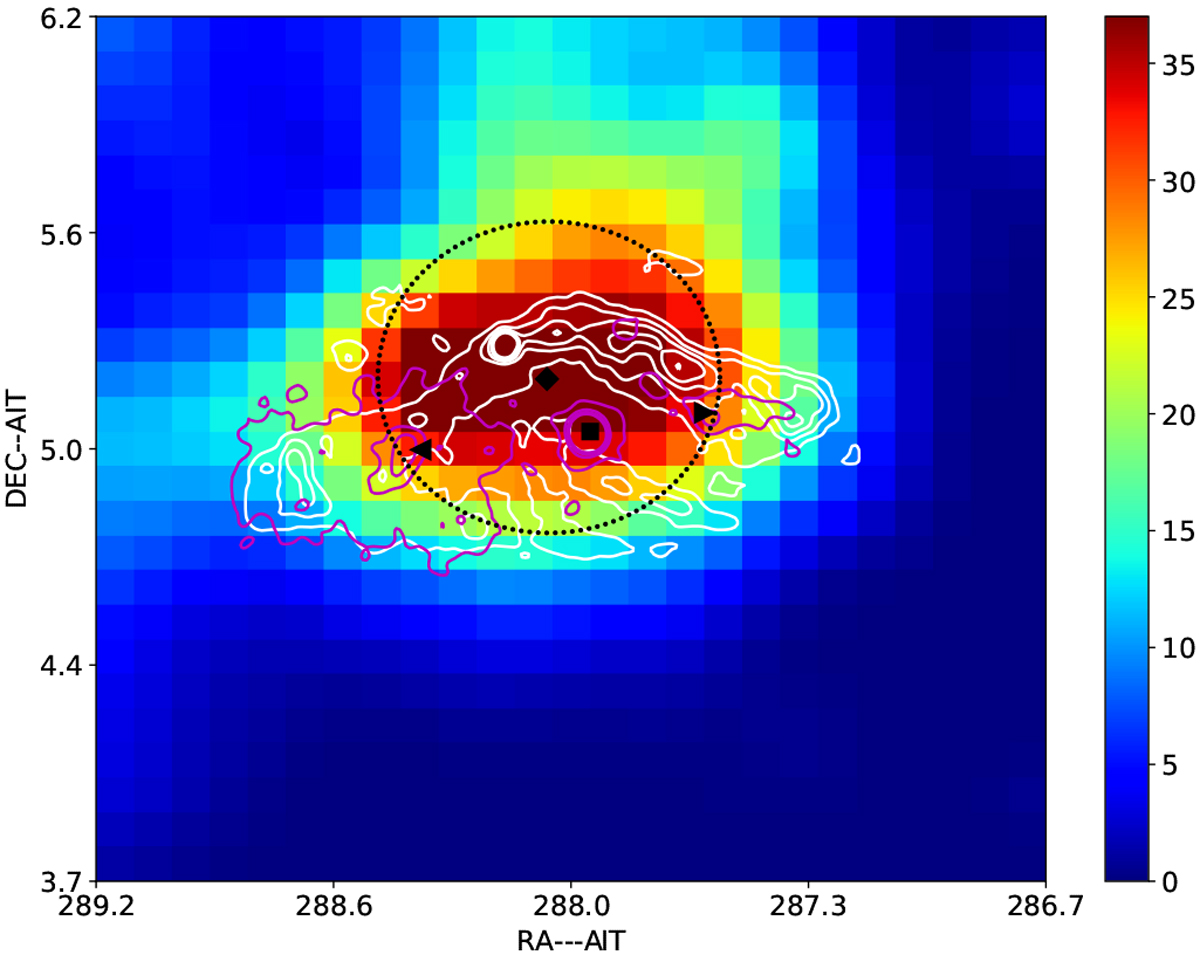
TS residual map above 500 MeV in the 2.5° × 2.5° region around SS433/W50 system, with pixel size corresponding to 0.1° × 0.1°. The square shows the nominal position of SS433, and the diamond indicates the best-fit position. The left and right triangles (e1 and w1) mark the fixed positions for the fitting of the VHE excesses detected by HAWC. The contours in white show the main features of the studied region using the radio observation, smoothed with a Gaussian kernel of 0.1°. Contours start at 10 mJy beam−1 and increase in steps of 40 mJy beam−1. The magenta contours show the X-ray emission, smoothed with a Gaussian filter of 0.17°. The dashed circle with a radius of 0.45° shows the size of the assumed uniform disk used for spatial analysis.
Current usage metrics show cumulative count of Article Views (full-text article views including HTML views, PDF and ePub downloads, according to the available data) and Abstracts Views on Vision4Press platform.
Data correspond to usage on the plateform after 2015. The current usage metrics is available 48-96 hours after online publication and is updated daily on week days.
Initial download of the metrics may take a while.