Fig. 6.
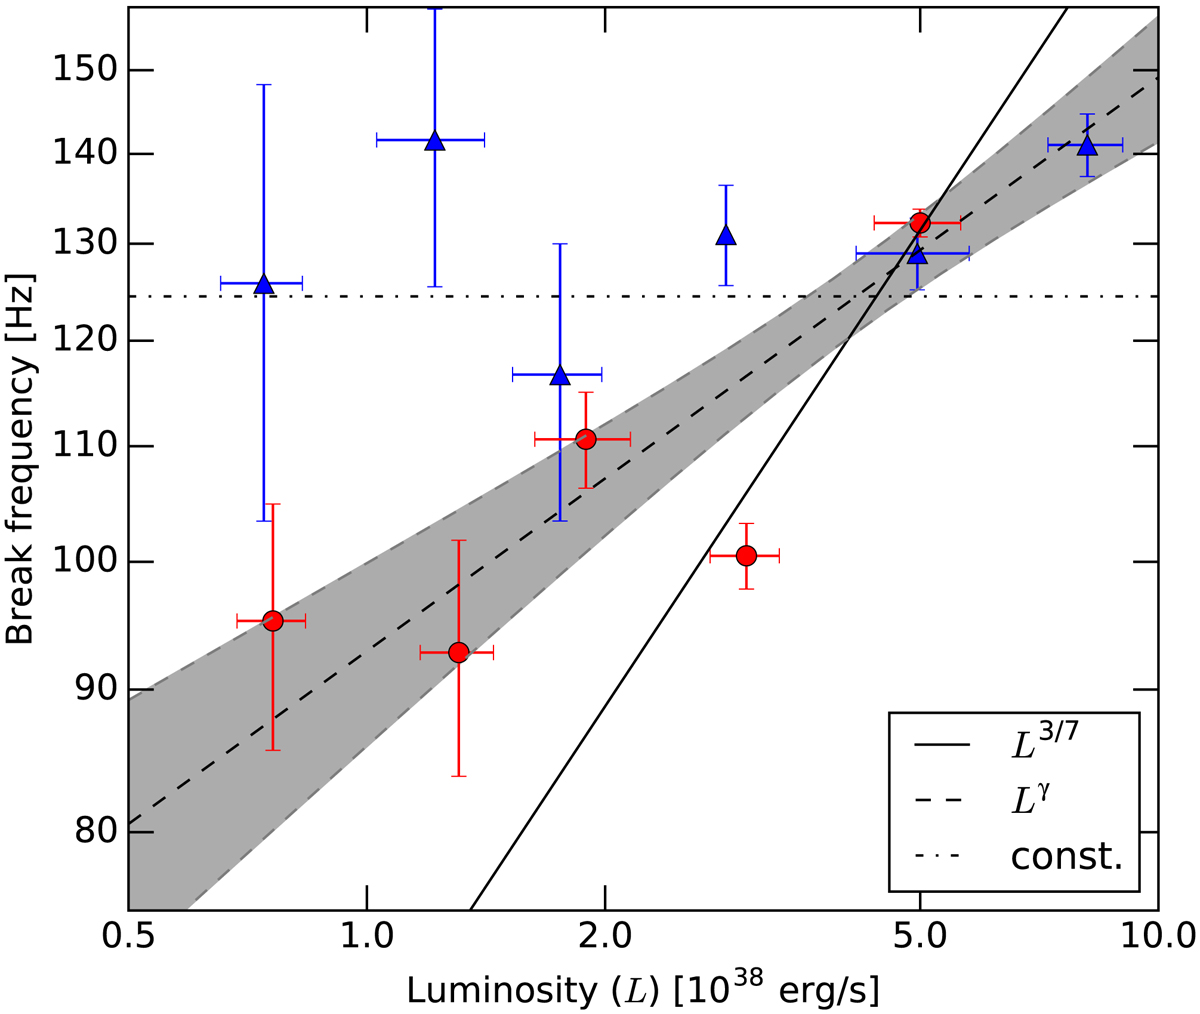
Break frequencies from the fits to the high-frequency bumps of PDSs plotted against the luminosity. Blue triangles correspond to the first major outburst and red circles to the second major outburst. The fits of luminosity-dependences to break frequency data from the major outbursts are shown. The scaling constant is a free parameter in all of the fits. For the free slope, we get an index of γ = 0.21 ± 0.02. The confidence interval calculated from the fit scatter is also provided (shaded gray).
Current usage metrics show cumulative count of Article Views (full-text article views including HTML views, PDF and ePub downloads, according to the available data) and Abstracts Views on Vision4Press platform.
Data correspond to usage on the plateform after 2015. The current usage metrics is available 48-96 hours after online publication and is updated daily on week days.
Initial download of the metrics may take a while.