Free Access
Fig. 5.
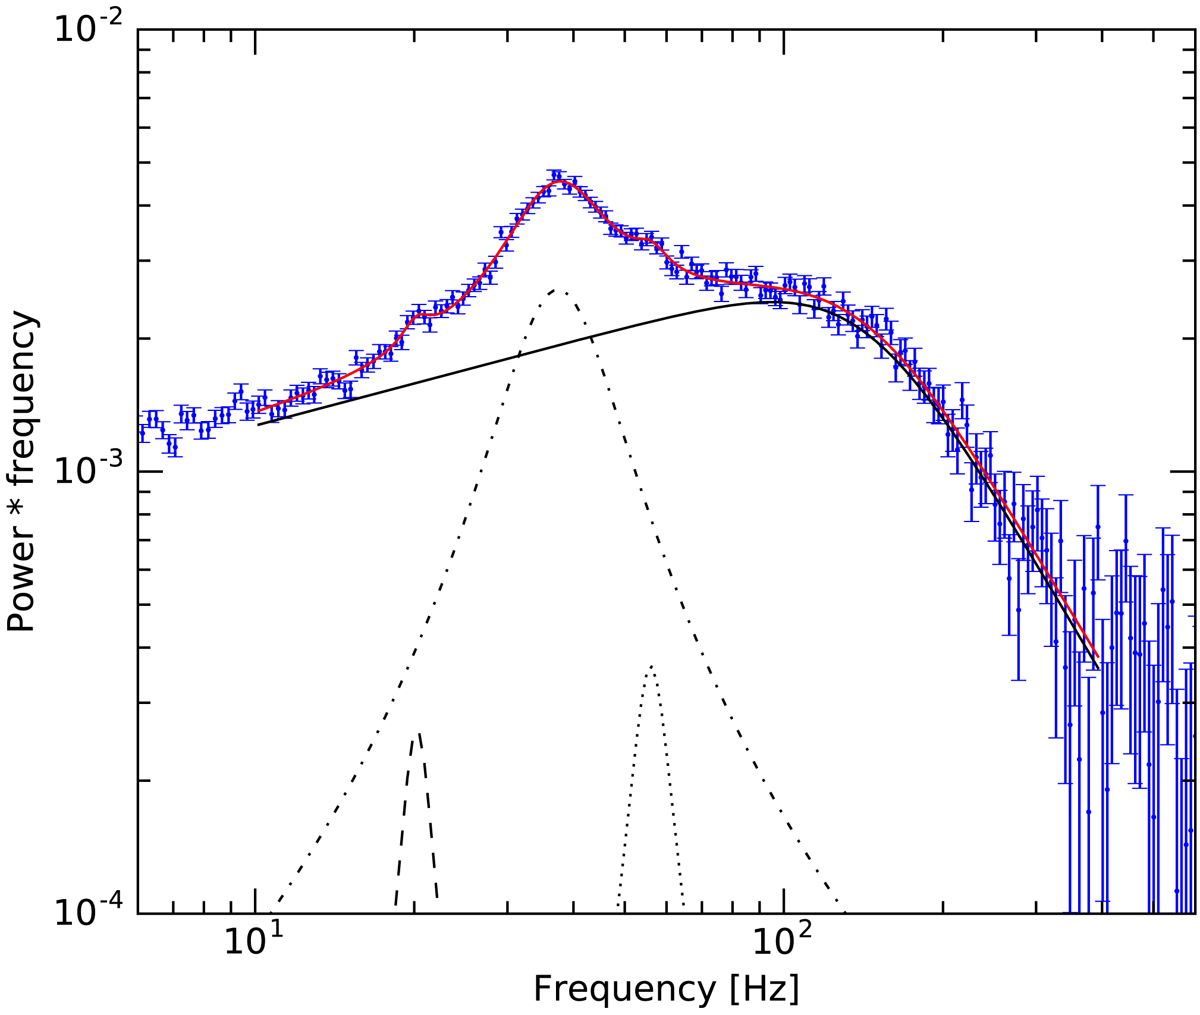
Observed PDS of GRO J1744−28 at the peak of the first outburst (blue dots with error bars) and the best-fit model (red curve) in a frequency range from 10 to 400 Hz. The model consists of a smoothly broken power law (solid black curve) and three Lorentzians shown by dashed, dot-dashed and dotted curves.
Current usage metrics show cumulative count of Article Views (full-text article views including HTML views, PDF and ePub downloads, according to the available data) and Abstracts Views on Vision4Press platform.
Data correspond to usage on the plateform after 2015. The current usage metrics is available 48-96 hours after online publication and is updated daily on week days.
Initial download of the metrics may take a while.