Fig. 3.
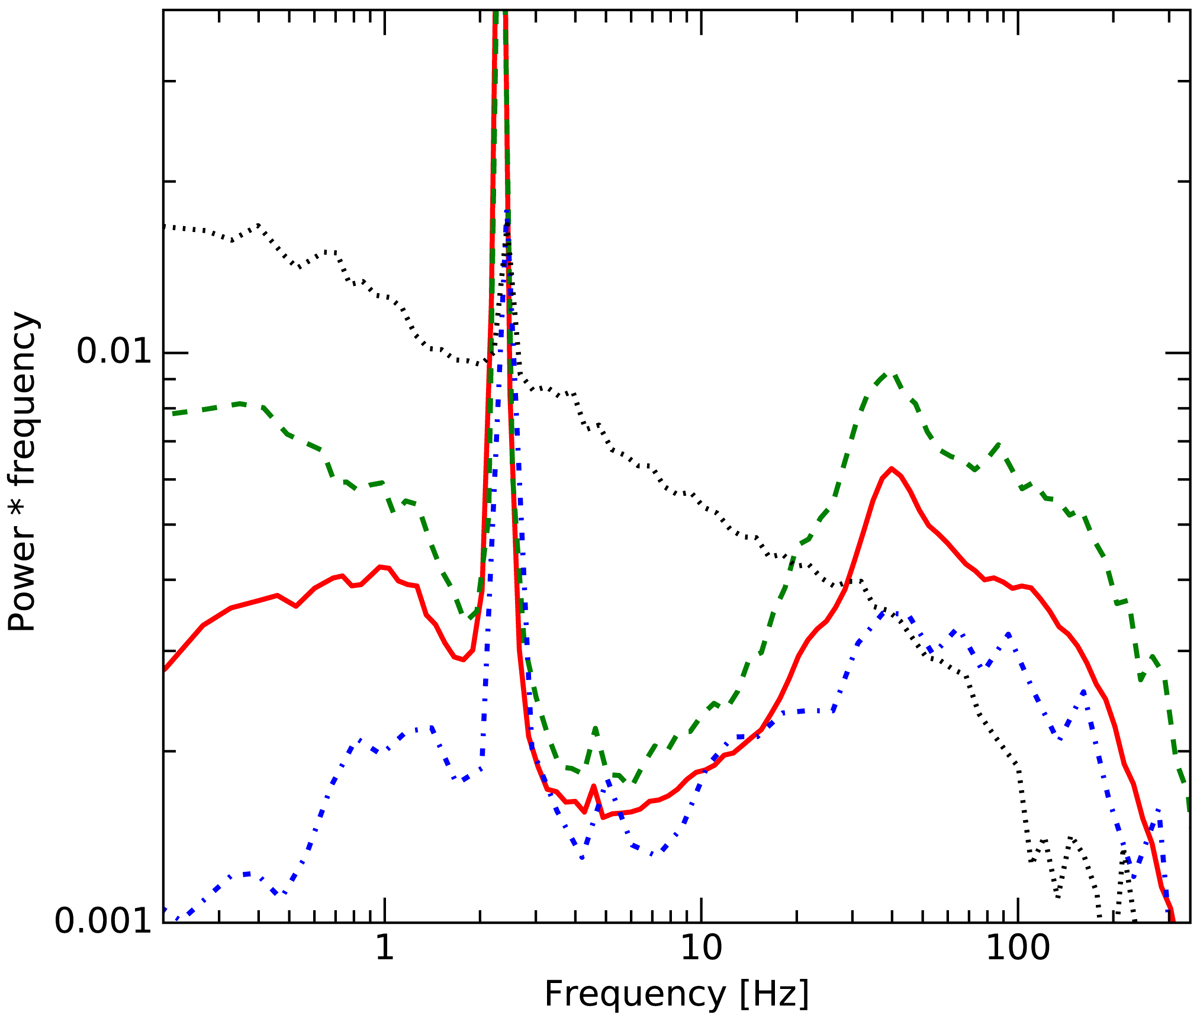
Broadband PDS of the persistent light curve corresponding to different luminosity levels during the second outburst decay and the first mini-outburst. The red line corresponds to the luminosity of L = 5.0 × 1038 erg s−1, the green dashed line to L = 7.6 × 1037 erg s−1, blue dot dashed to L = 2.5 × 1037 erg s−1. The dotted line is from the mini-outburst at luminosity L = 8.8 × 1037 erg s−1. The PDS were logarithmically rebinned with respect to frequency to suppress the noise at the highest frequencies. The dominating regular pulsations are visible around 2 Hz. QPO features are seen around 20, 40 and 60 Hz. A PDS component between 5 and 200 Hz is referred to as the high-frequency bump. Note that the Miyamoto normalization was used, rebinning at lower luminosity seemingly shifts the pulse frequency and error bars were left out for clarity.
Current usage metrics show cumulative count of Article Views (full-text article views including HTML views, PDF and ePub downloads, according to the available data) and Abstracts Views on Vision4Press platform.
Data correspond to usage on the plateform after 2015. The current usage metrics is available 48-96 hours after online publication and is updated daily on week days.
Initial download of the metrics may take a while.