Fig. 1.
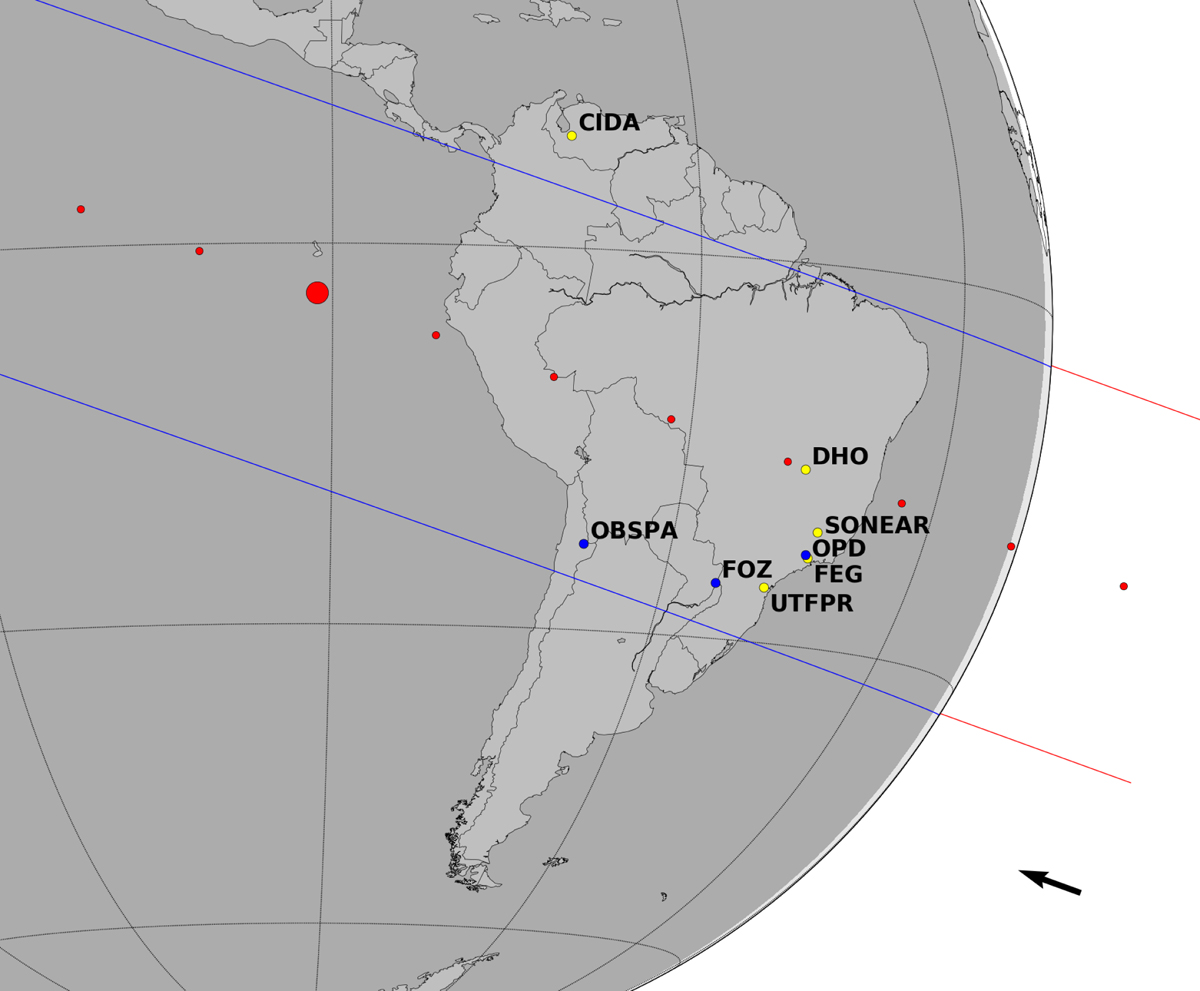
Occultation by Europa on 2017 March 31. The centre of the body at the time of closest approach between the shadow and the geocentre (CA), at 06:44:36 UTC, is represented by the large red dot. Blue lines represent the size limit of Europa (1561.2 ± 3.6 km). The small red dots represent the centre of the body, each separated by 1 min from the reference instant CA. The blue dots are the observers with positive detection, and the yellow dots are observers that were unable to obtain the light curve due to bad weather conditions. The offset between our result and the prediction (using the JPL jup310 ephemeris) was −0.90 ± 3.1 km for fc and −12.3 ± 2.0 km for gc, see Sect. 3. The black arrow at the bottom represents the direction of motion of the shadow.
Current usage metrics show cumulative count of Article Views (full-text article views including HTML views, PDF and ePub downloads, according to the available data) and Abstracts Views on Vision4Press platform.
Data correspond to usage on the plateform after 2015. The current usage metrics is available 48-96 hours after online publication and is updated daily on week days.
Initial download of the metrics may take a while.