Fig. 8
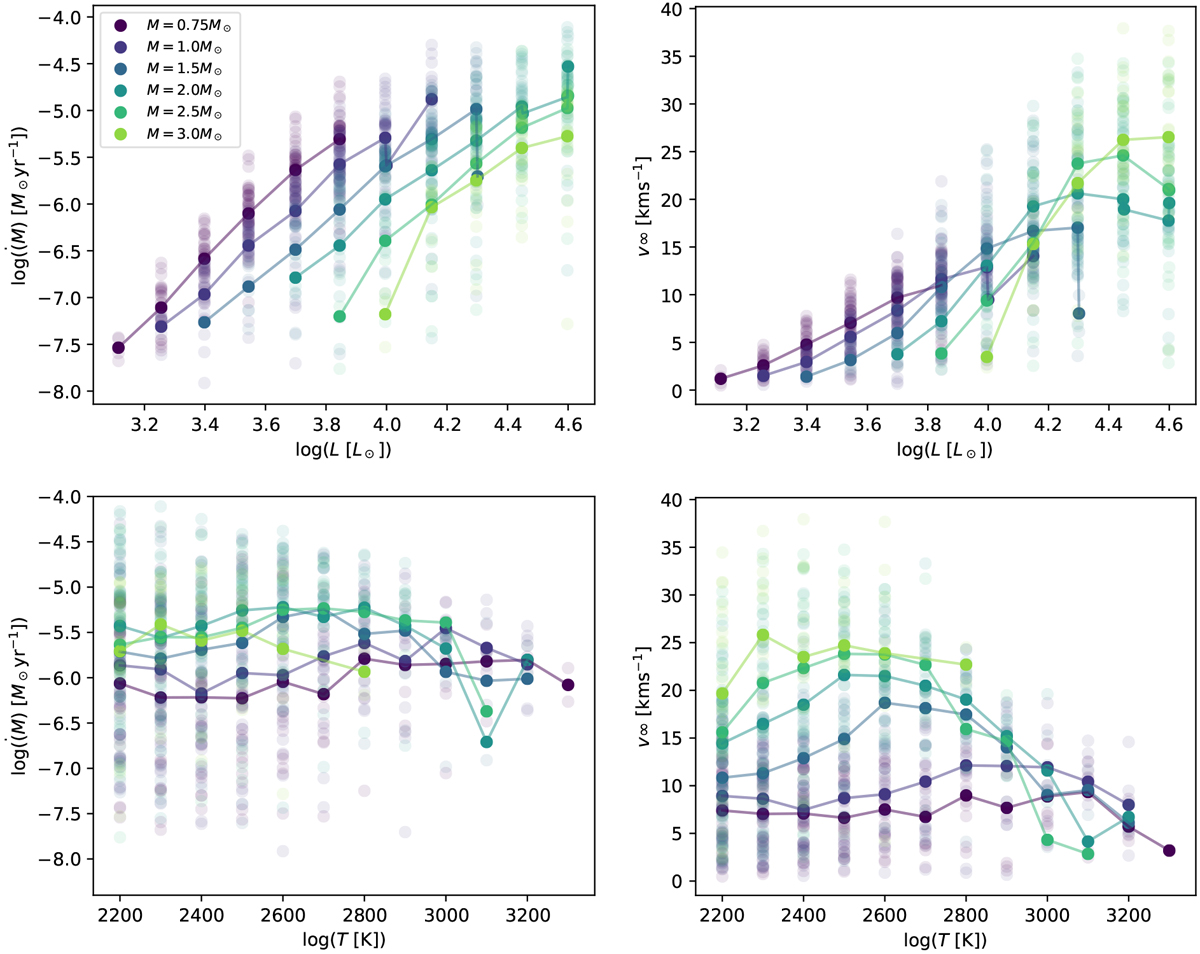
Mass-loss rate (left panels) and wind-velocity (right panels) for all models that develop a wind (indicated in red in Fig. 6) plotted as a function of luminosity (top panels) and effective temperature (lower panels). The data in all panels are colour-coded according to stellar mass. The linked points show the average mass-loss rate at the indicated luminosities or effective temperature for a specific mass (indicated by the colour-coding).
Current usage metrics show cumulative count of Article Views (full-text article views including HTML views, PDF and ePub downloads, according to the available data) and Abstracts Views on Vision4Press platform.
Data correspond to usage on the plateform after 2015. The current usage metrics is available 48-96 hours after online publication and is updated daily on week days.
Initial download of the metrics may take a while.