Fig. 6
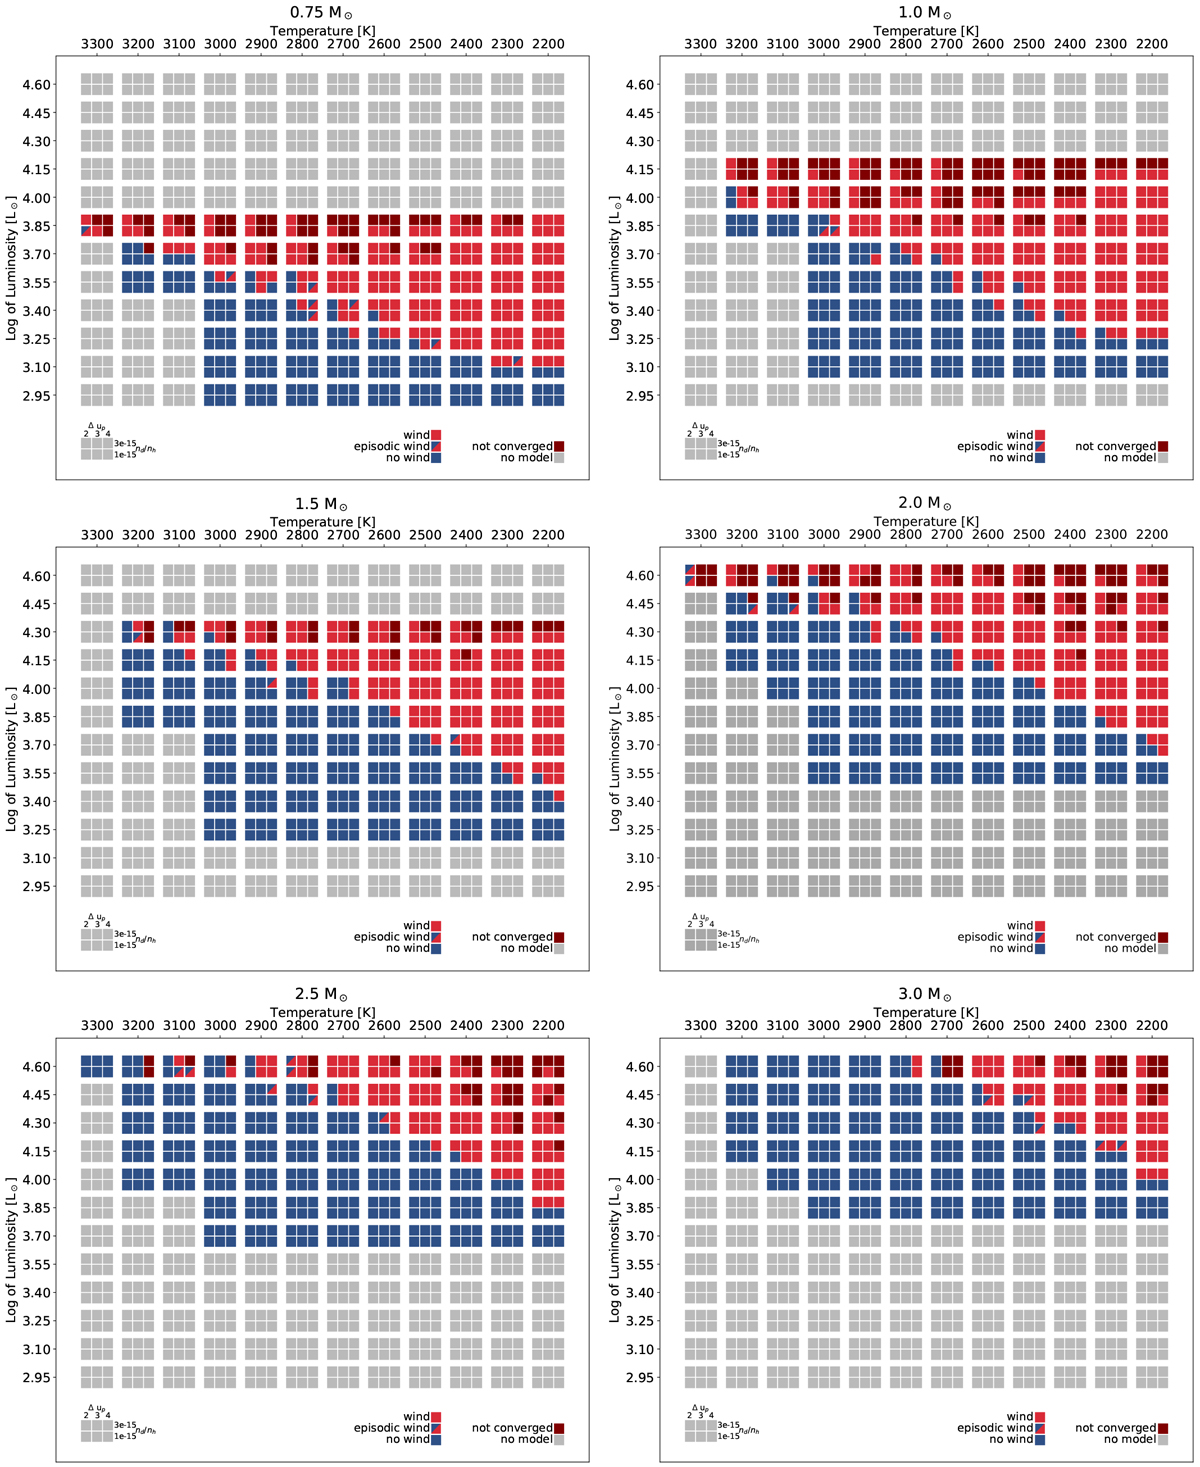
Schematic overview showing the dynamic behaviour of the models in the grid as a function of the model parameters. The different panels show maps for different stellar masses. The temperature increases to the left in a format resembling a HR diagram. The red boxes represent models with a stellar wind, the blue boxes represent models with no wind, the boxes with red/blue triangles represent models with episodic mass loss, the grey boxes indicate combinations of parameters not tested, and the dark red boxes represent models that develop a wind but fail to converge for numerical reasons. For each combination of luminosity and effective temperature the seed particle abundance and piston velocity are varied as indicated bythe inset box in the bottom left corner of each panel.
Current usage metrics show cumulative count of Article Views (full-text article views including HTML views, PDF and ePub downloads, according to the available data) and Abstracts Views on Vision4Press platform.
Data correspond to usage on the plateform after 2015. The current usage metrics is available 48-96 hours after online publication and is updated daily on week days.
Initial download of the metrics may take a while.