Fig. 13
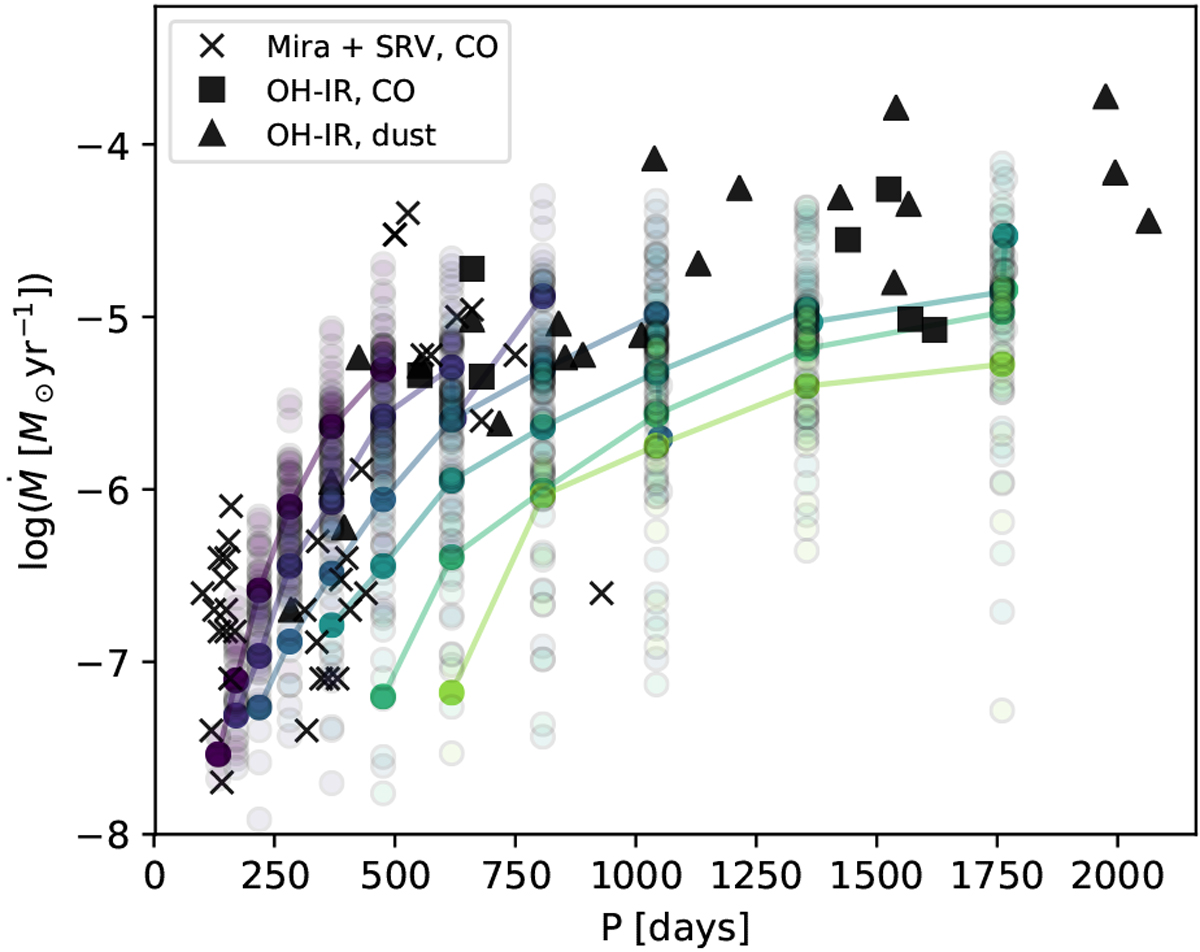
Mass-loss rate as a function of pulsation period for all models that develop a wind (indicated in red in Fig. 6), colour-coded according to stellar mass (as in Fig. 8). The linked points show the average mass-loss rate at the indicated periods for a specific mass. We also include observations of nearby M-type AGB stars (Olofsson et al. 2002; González Delgado et al. 2003) based on CO line emission, as well as a set of OH/IR stars (De Beck et al. 2010; He & Chen 2001) with mass-loss estimates based on CO-lines and dust, respectively.
Current usage metrics show cumulative count of Article Views (full-text article views including HTML views, PDF and ePub downloads, according to the available data) and Abstracts Views on Vision4Press platform.
Data correspond to usage on the plateform after 2015. The current usage metrics is available 48-96 hours after online publication and is updated daily on week days.
Initial download of the metrics may take a while.