Fig. 12
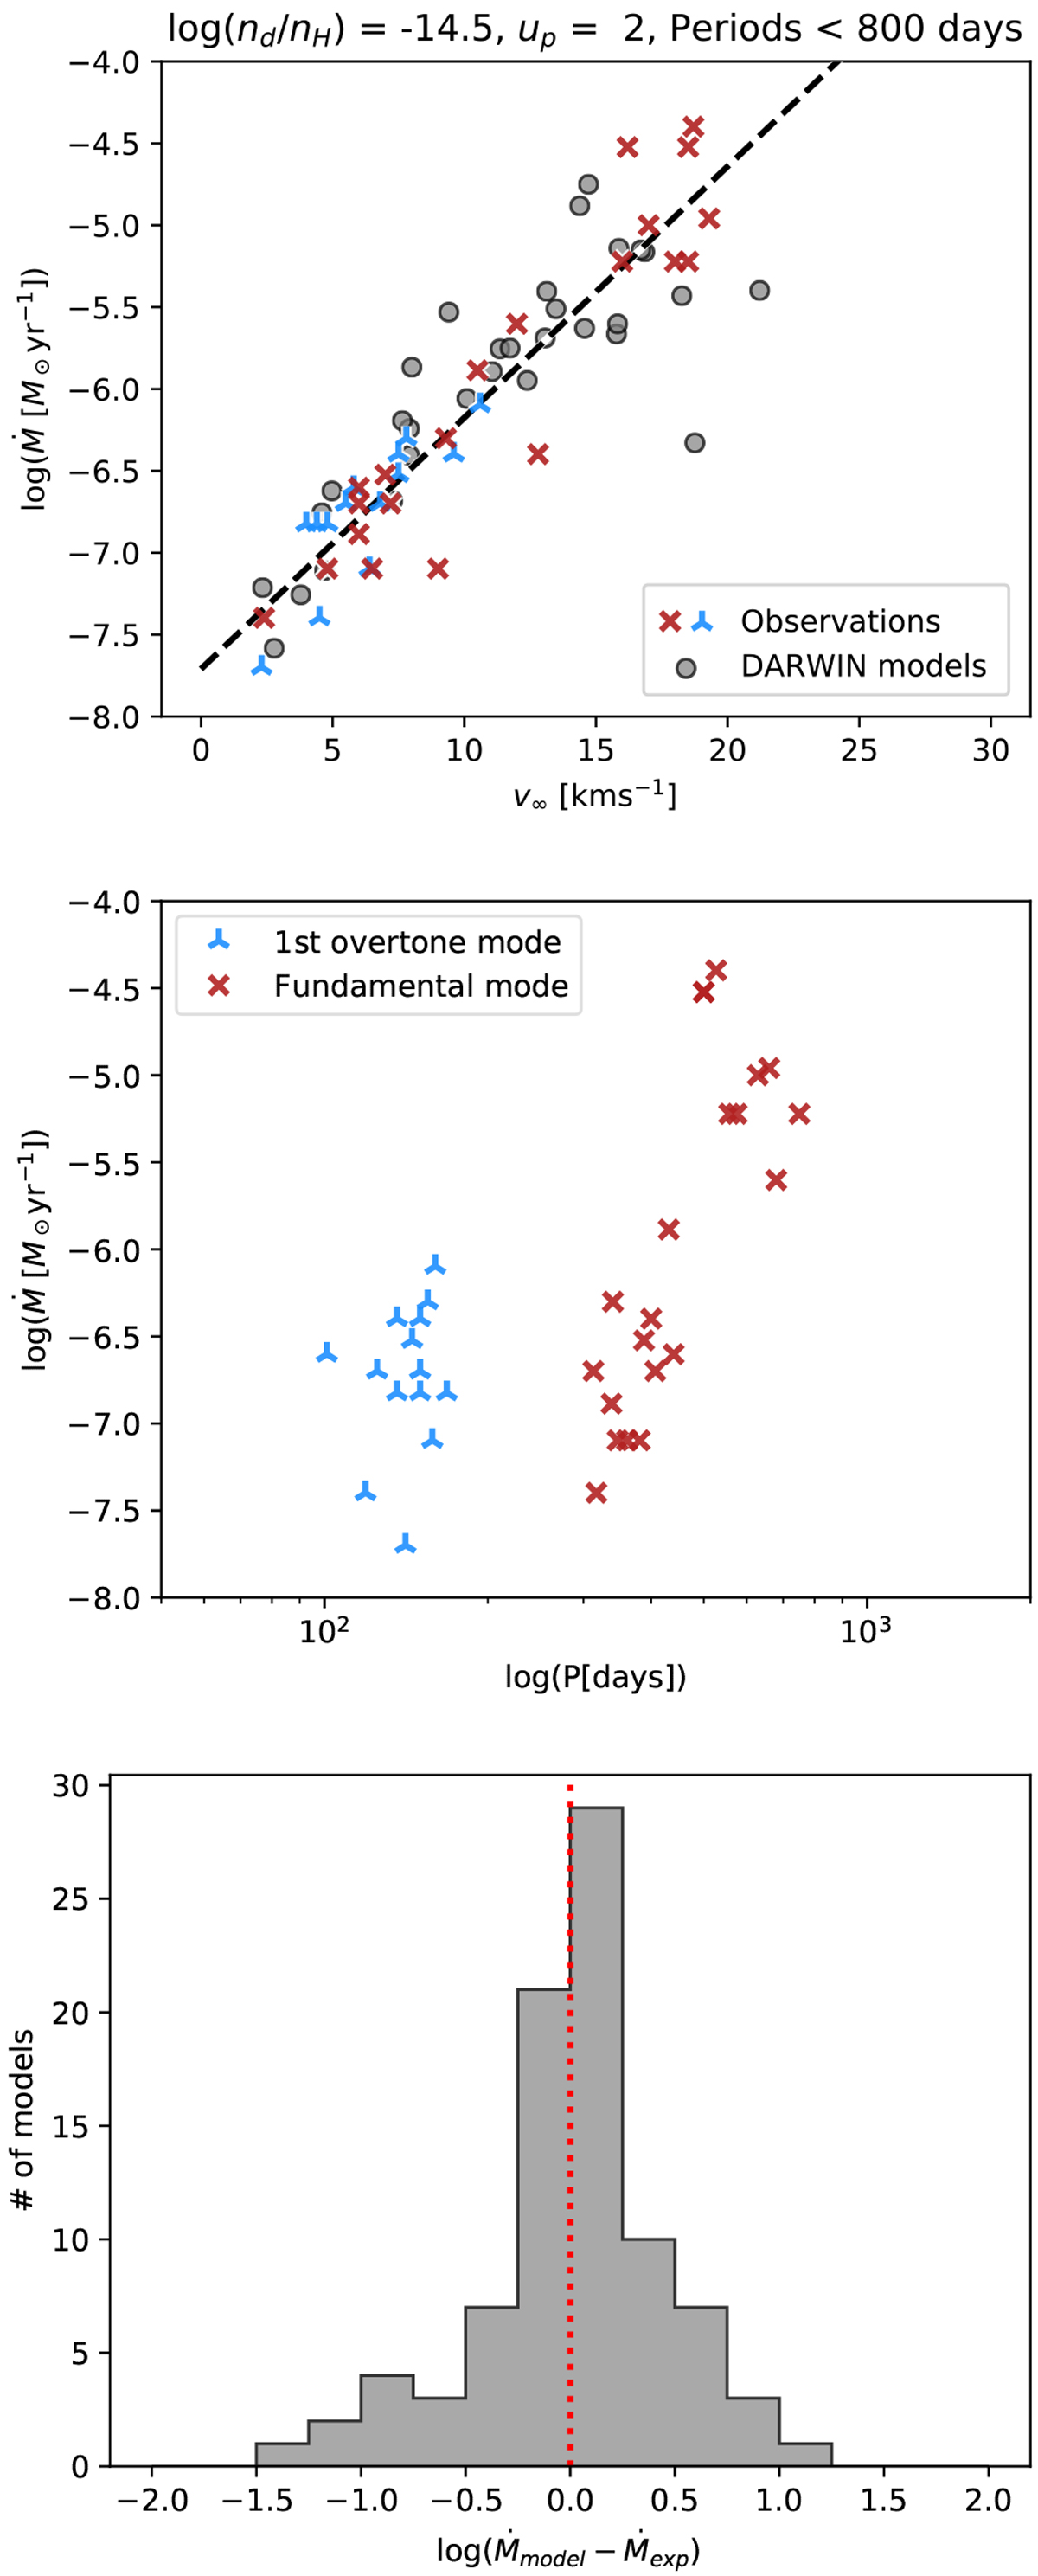
Top panel: mass-loss rates and wind velocities of M-type AGB stars derived from observations of several CO lines (Olofsson et al. 2002; González Delgado et al. 2003), and the corresponding properties of models with the combination of log(nd ∕nH) = − 14.5 and up = 2.0, and with P < 800 days. The blue and red symbols indicate stars presumably pulsating in first overtone and fundamental mode, respectively. The dashed line is the linear fit to the observed values. Middle panel: mass-loss rate as a function of pulsation period for the same observational sample. Lower panel: difference between the mass-loss rates of the models and the expected values from the observational linear fit.
Current usage metrics show cumulative count of Article Views (full-text article views including HTML views, PDF and ePub downloads, according to the available data) and Abstracts Views on Vision4Press platform.
Data correspond to usage on the plateform after 2015. The current usage metrics is available 48-96 hours after online publication and is updated daily on week days.
Initial download of the metrics may take a while.