Fig. 1
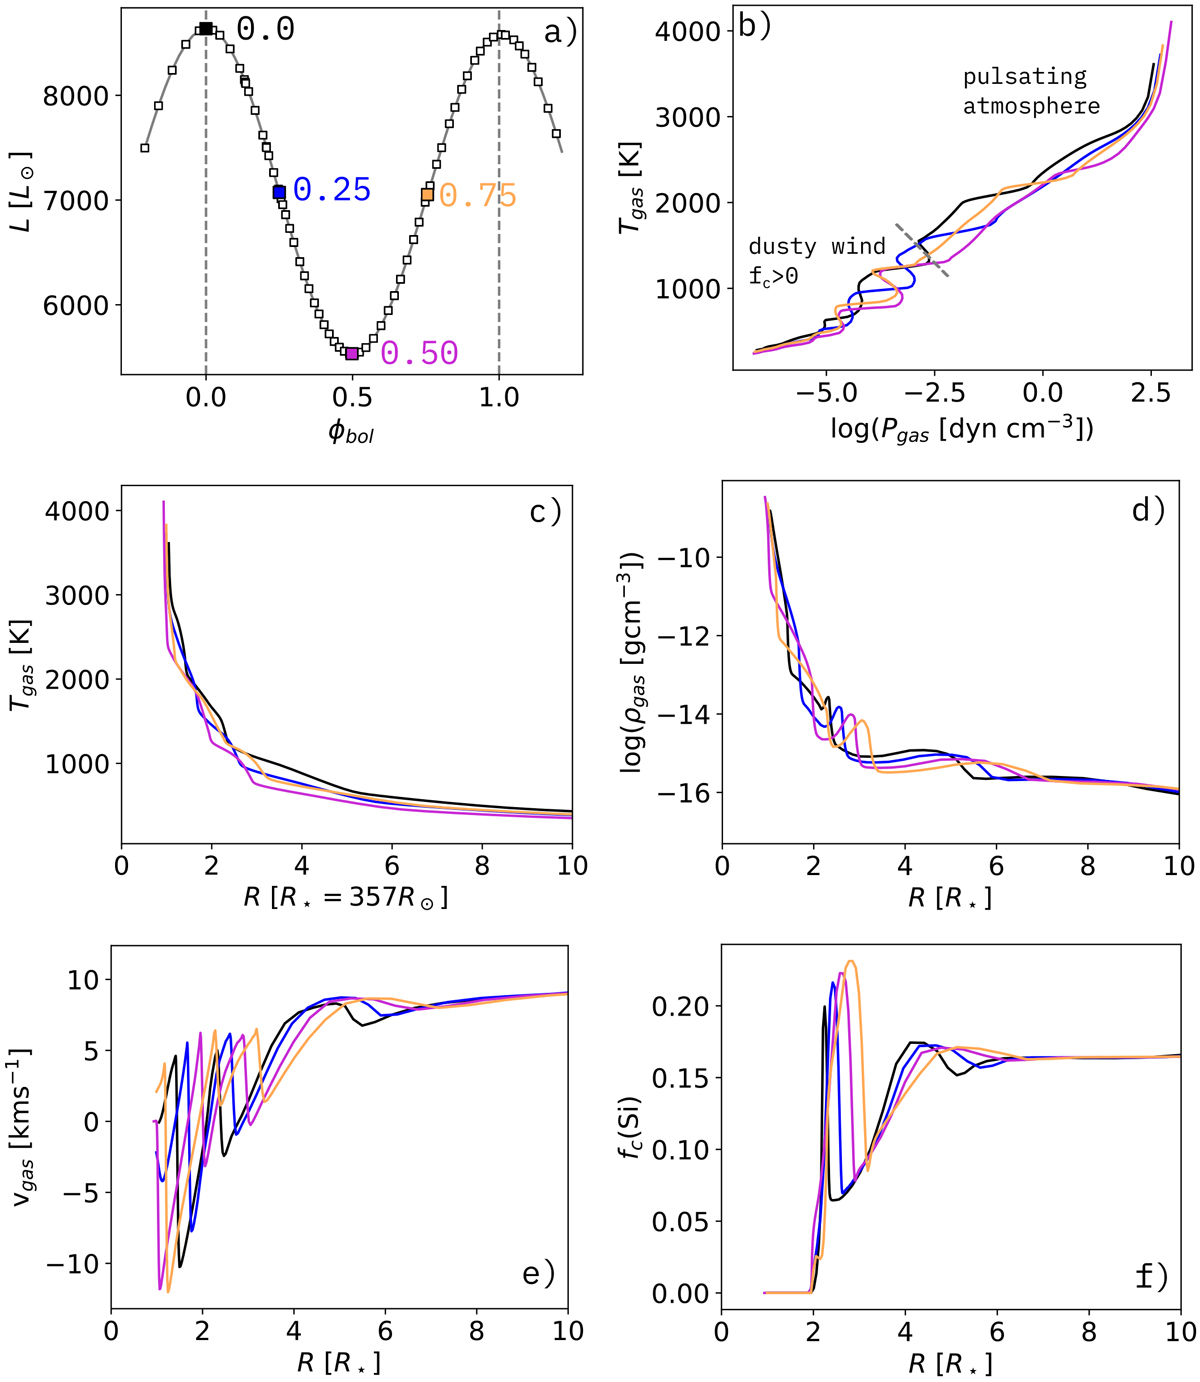
Characteristic properties of a DARWIN model with M* = 1 M⊙, log L* = 3.85 L⊙, T* = 2700 K, up = 2 km s−1, and log (nd∕nH) = − 15.0. Panel a: bolometric light curve resulting from the variable inner boundary. The boxes indicate instances of time for which snapshots of the atmospheric structure were stored, partly labelled with the corresponding bolometric phase. The dotted vertical lines indicate the points in time of Φbol = 0.0 and 1.0. The other panels show the atmospheric structures of selected phases during one pulsation cycle (colour-coded in the same way as the phase labels in panel a). Panel b: gas temperature vs. gas pressure used to characterise classic hydrostatic stellar atmospheres. The middle and lower panels illustrate the radial structures of gas temperatures (panel c), gas densities (panel d), gas velocities (panel e), and degree of Si condensed into Mg2SiO4 grains (panel f). The plots are cut at 10 stellar radii to provide better resolution of the dynamically important region.
Current usage metrics show cumulative count of Article Views (full-text article views including HTML views, PDF and ePub downloads, according to the available data) and Abstracts Views on Vision4Press platform.
Data correspond to usage on the plateform after 2015. The current usage metrics is available 48-96 hours after online publication and is updated daily on week days.
Initial download of the metrics may take a while.