Fig. 6.
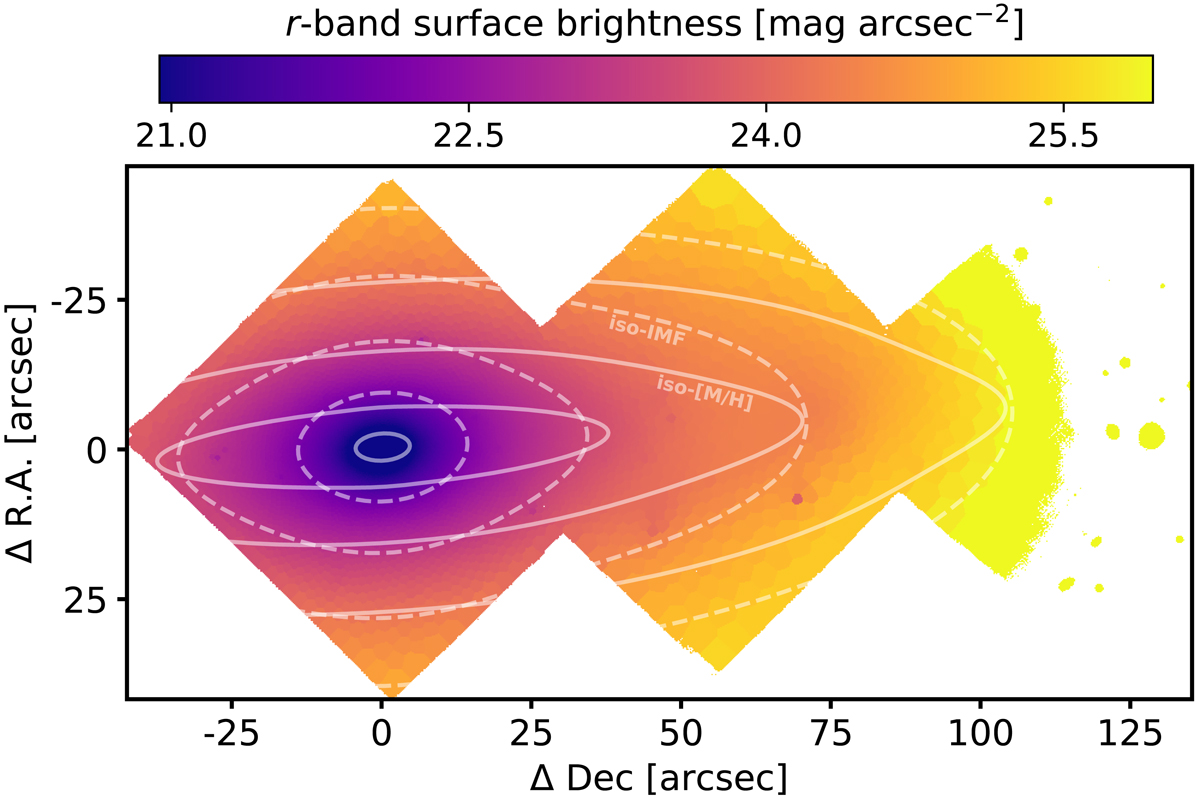
Iso-metallicity vs. iso-IMF contours. The surface brightness map of FCC 167 is shown as measured from the F3D data cube, with the iso-metallicity (solid lines) and iso-IMF contours (dashed lines) overplotted. As in Fig. 4, this figure shows that the 2D IMF map does not exactly follow the metallicity variations. IMF variations appear more closely related to the surface brightness distribution, in particular, around the central bulge. The metallicity distribution, in contrast, is structured in a more disk-like configuration.
Current usage metrics show cumulative count of Article Views (full-text article views including HTML views, PDF and ePub downloads, according to the available data) and Abstracts Views on Vision4Press platform.
Data correspond to usage on the plateform after 2015. The current usage metrics is available 48-96 hours after online publication and is updated daily on week days.
Initial download of the metrics may take a while.