Fig. 9.
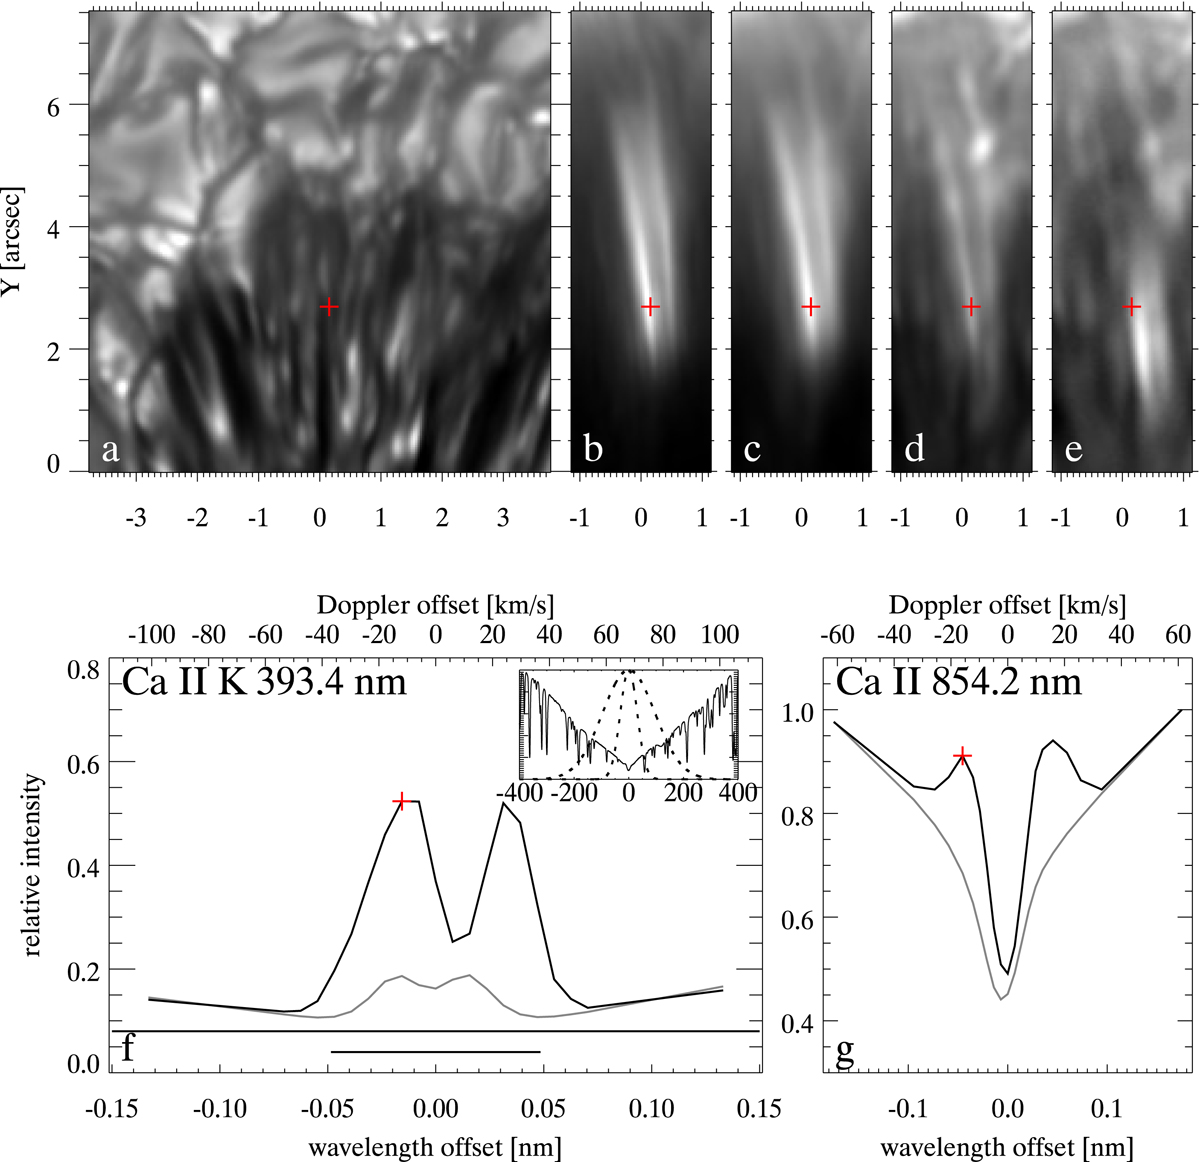
Examples of spectrally resolved PMJs. Panel a: photospheric CHROMIS wideband reference image (center wavelength 395.0 nm and bandwidth FWHM = 1.32 nm). Panel b: CHROMIS Ca II K image at a Doppler offset of −12 km s−1. Panel c: CHROMIS Ca II K image integrated over the full sampled spectral profile, convolved with a Gaussian profile with FWHM = 0.1 nm. Panel d: similar integrated CHROMIS Ca II K image, convolved with a FWHM = 0.3 nm Gaussian, and giving enhanced weight to the two outer scan positions. Panel e: CRISP Ca II 854.2 nm image at a Doppler offset of −16 km s−1. The red crosses in the images mark the spatial location in the PMJ for which spectral profiles are shown in panels f and g. The thick solid lines in panels f and g show the Ca II K and Ca II 854.2 nm PMJ spectral profiles, and the red crosses mark the spectral positions of panels b and e, respectively. The gray lines are reference spectral profiles averaged over a region outside the active region. Panel f: horizontal lines of width 0.3 and 0.1 nm as reference to the FWHM bandwidth of the Hinode and SST imaging filters. The inset in panel f shows a Ca II H spectral profile from the FTS atlas (Neckel 1999) against Doppler velocity offset. The dashed lines are Gaussian profiles with FWHM = 0.3 and 0.1 nm.
Current usage metrics show cumulative count of Article Views (full-text article views including HTML views, PDF and ePub downloads, according to the available data) and Abstracts Views on Vision4Press platform.
Data correspond to usage on the plateform after 2015. The current usage metrics is available 48-96 hours after online publication and is updated daily on week days.
Initial download of the metrics may take a while.