Fig. 8.
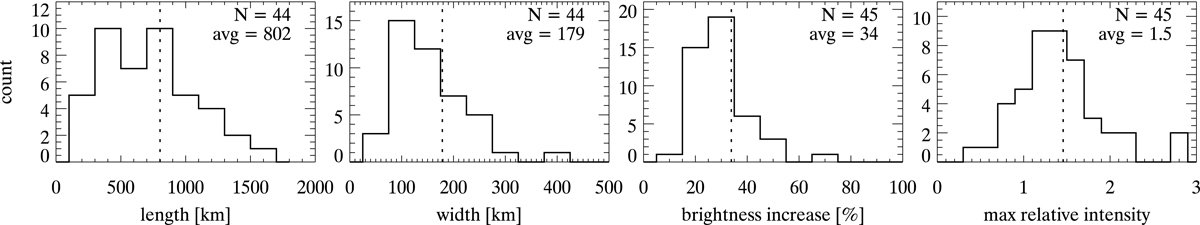
Histograms for the lengths, widths, brightness increase, and maximum relative intensity for the PMJs we analyzed. Length and width are measured as the FWHM at the time of maximum PMJ brightness. For PMJ I, no meaningful length and width could be measured. The brightness increase is measured as the intensity increase at a fixed position in the space-time diagram from the minimum to the maximum PMJ intensity. The fixed position is the black line in Figs. 2–6. The maximum PMJ intensity is relative to the average Ca II H intensity in a relatively quiet area outside the sunspot.
Current usage metrics show cumulative count of Article Views (full-text article views including HTML views, PDF and ePub downloads, according to the available data) and Abstracts Views on Vision4Press platform.
Data correspond to usage on the plateform after 2015. The current usage metrics is available 48-96 hours after online publication and is updated daily on week days.
Initial download of the metrics may take a while.