Fig. 7.
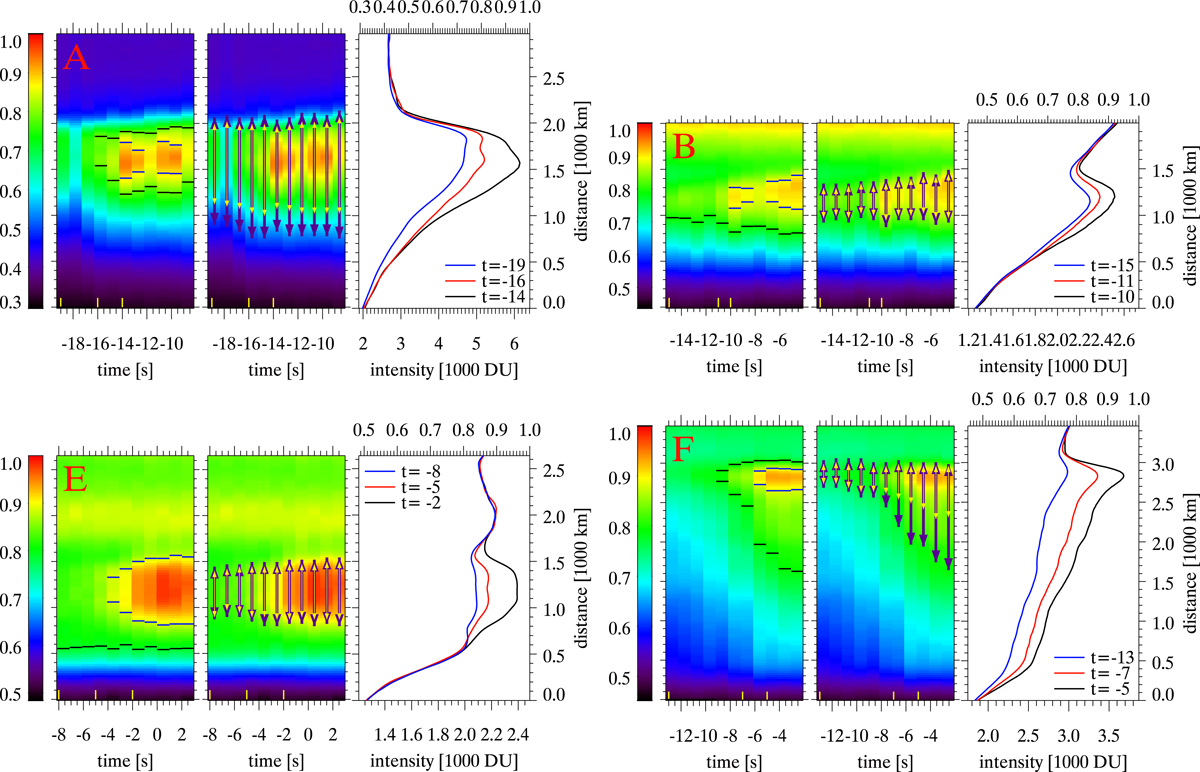
Detailed look at the onset of PMJs. Two identical space-time diagrams are shown, with the color-scaling (shown at left) relative to the maximum intensity of the PMJ at t = 0. In the left diagram, horizontal blue and black lines serve as contours at the 90% and 80% intensity levels, respectively, relative to the maximum of the PMJ. In the right space-time diagram, the vertical lines with arrowheads show the full width at 25% (FWQM, thick purple) and 50% (FWHM, thin yellow) of the maximum intensity at that time step. Right panel: intensity profiles for three selected time steps. Time is relative to the maximum intensity of the PMJ (t = 0 s). The PMJs are identified by the letters in the upper left corner, which refer to PMJ A and B in Fig. 2 and PMJ E and F in Fig. 4.
Current usage metrics show cumulative count of Article Views (full-text article views including HTML views, PDF and ePub downloads, according to the available data) and Abstracts Views on Vision4Press platform.
Data correspond to usage on the plateform after 2015. The current usage metrics is available 48-96 hours after online publication and is updated daily on week days.
Initial download of the metrics may take a while.