Fig. 4.
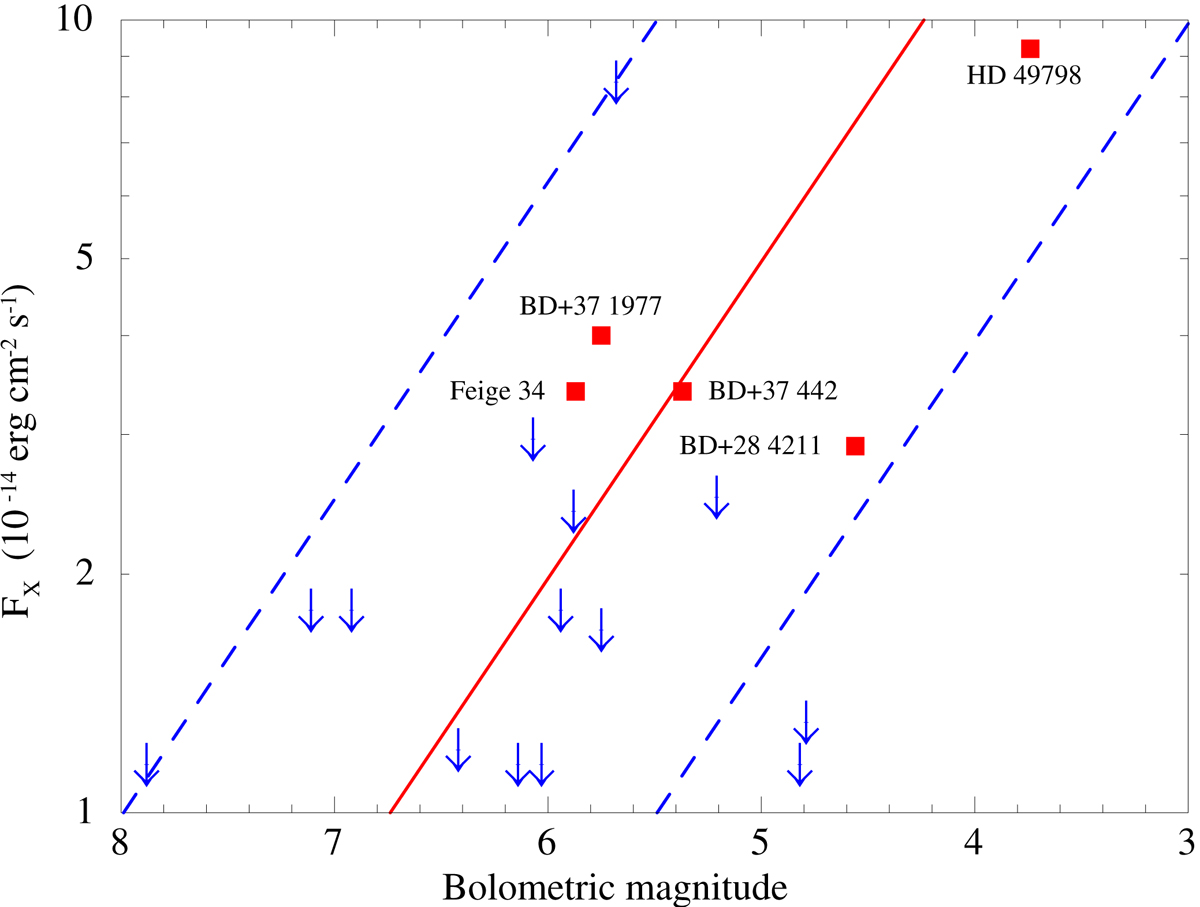
Relation between the X-ray flux (or its upper limit for the undetected sources) and the bolometric magnitude of the sdO stars observed at X-rays. The continuous red line represents the best-fit relation (fX/fbol = 10−6.7) for the main-sequence early-type stars (Nazé 2009), while the area between the two blue lines (fX/fbol = 10−6.2 and fX/fbol = 10−7.2, respectively) corresponds to the dispersion of this relation.
Current usage metrics show cumulative count of Article Views (full-text article views including HTML views, PDF and ePub downloads, according to the available data) and Abstracts Views on Vision4Press platform.
Data correspond to usage on the plateform after 2015. The current usage metrics is available 48-96 hours after online publication and is updated daily on week days.
Initial download of the metrics may take a while.