Fig. 4.
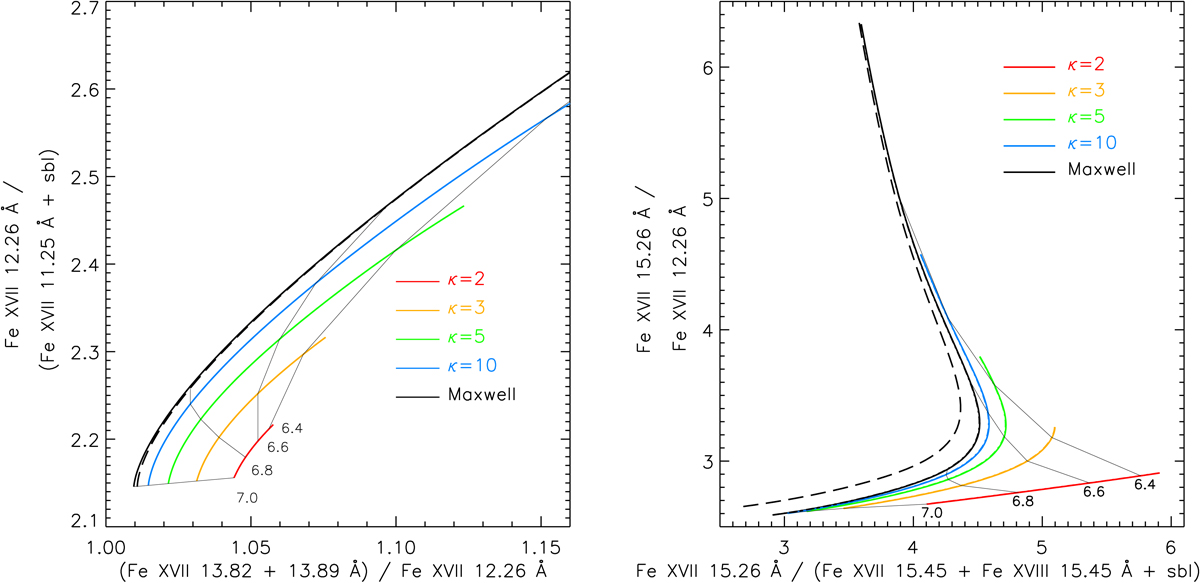
Diagnostics of κ and temperature from Fe XVII from the MaGIXS spectra. Ratios of line intensities (in photon units) are indicated, with wavelengths of the lines involved listed together with the main self-blends. Individual colors denote the distribution, with black for Maxwellian, and blue, green, orange, and red for κ-distribution with κ = 10, 5, 3, and 2, respectively. Full lines correspond to spectra with for Ne = 109 cm−3, while the dot-dashed lines correspond to Ne = 1011 cm−3. Black long-dashed lines (available only for the Maxwellian distribution) show the effects of the recombination and ionization to and from the upper excited levels, together with cascades. See Sect. 3.3 for more details.
Current usage metrics show cumulative count of Article Views (full-text article views including HTML views, PDF and ePub downloads, according to the available data) and Abstracts Views on Vision4Press platform.
Data correspond to usage on the plateform after 2015. The current usage metrics is available 48-96 hours after online publication and is updated daily on week days.
Initial download of the metrics may take a while.