Fig. 3.
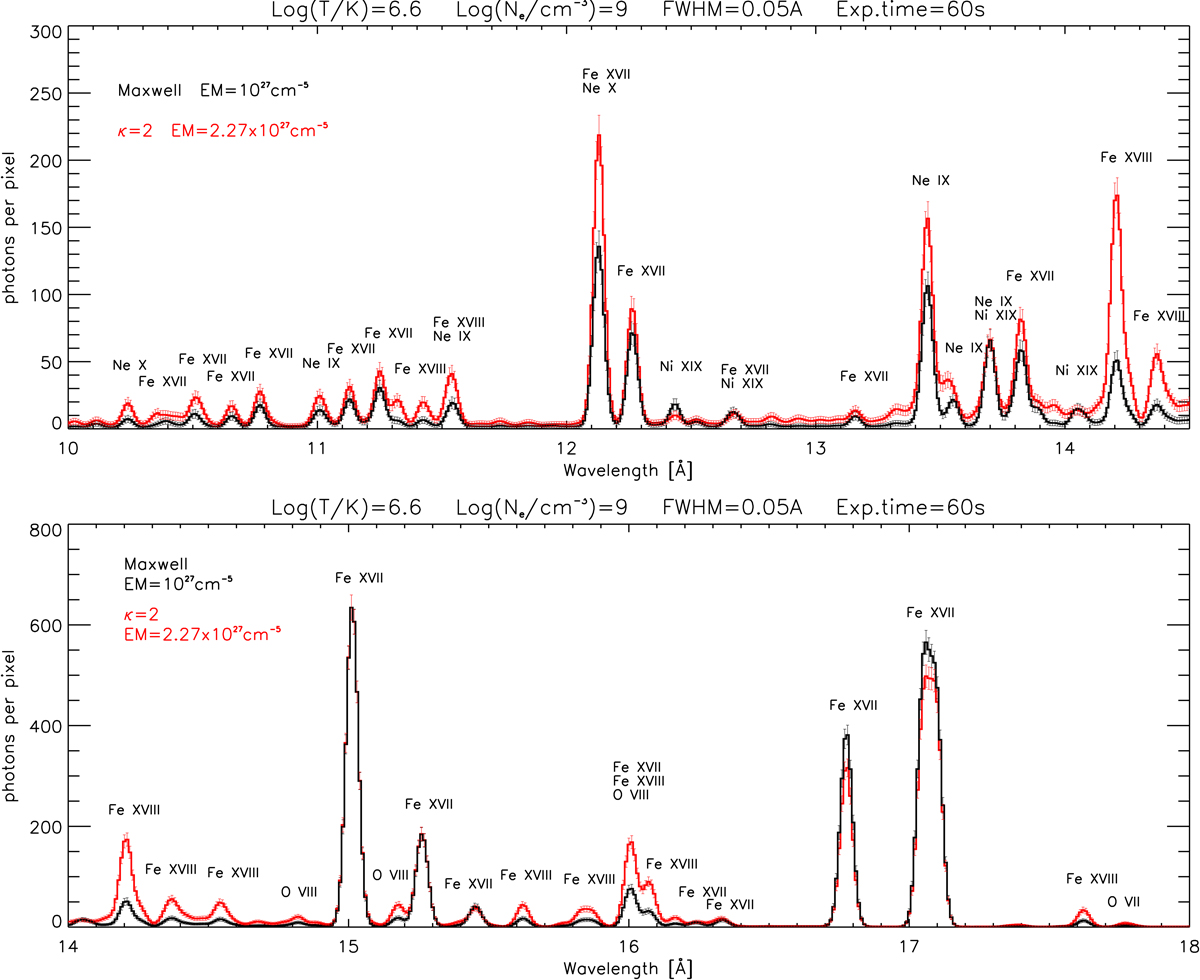
Example synthetic MaGIXS spectra at 10–18 Å. The Maxwellian spectrum (black) is compared here with a spectrum obtained for κ = 2 (red). Both spectra were calculated for log(T [K]) = 6.6 and Ne = 109 cm−3. Error-bars indicate photon noise uncertainty in a 60 s integration time. The assumed FWHM of the lines is 0.05 Å. Principal ions forming a particular spectral line are indicated. For details on blends see Appendix A.
Current usage metrics show cumulative count of Article Views (full-text article views including HTML views, PDF and ePub downloads, according to the available data) and Abstracts Views on Vision4Press platform.
Data correspond to usage on the plateform after 2015. The current usage metrics is available 48-96 hours after online publication and is updated daily on week days.
Initial download of the metrics may take a while.